The insurers pulling ahead start before FNOL arrives

As Chief Product Officer at Nearmap, David leads the vision and delivery of property intelligence solutions that power faster, more informed decisions. He has over two decades of experience building data-driven products that transform how insurers assess risk, improve efficiency, and serve their customers.
As Chief Product Officer at Nearmap, David leads the vision and delivery of property intelligence solutions that power faster, more informed decisions. He has over two decades of experience building data-driven products that transform how insurers assess risk, improve efficiency, and serve their customers.
As billion-dollar disasters become more frequent, the first advantage in claims is understanding the loss before the claim volume peaks.
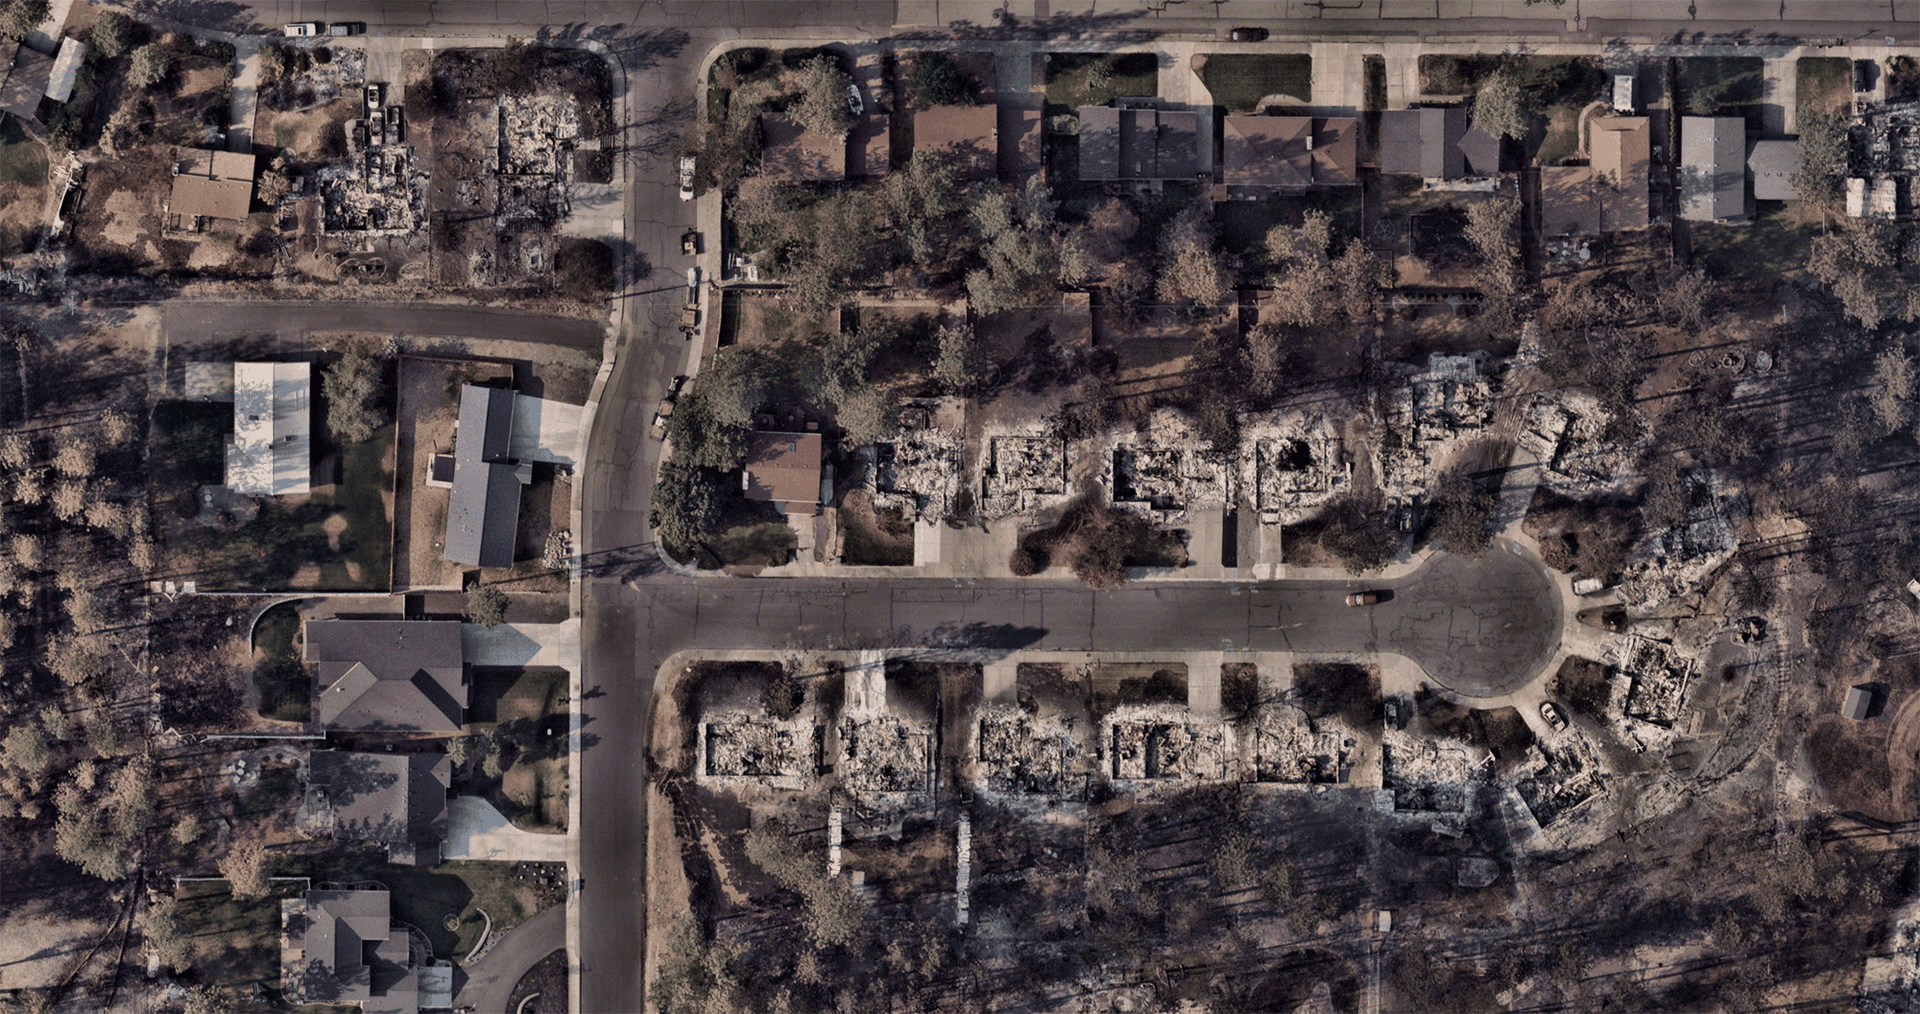
I had a roof claim on Christmas Eve. It was nothing like what families experience after a wildfire or hurricane, but it put me on the policyholder side of the process. You report the damage. Then you wait.
And the wait is long. Even with recent improvements, J.D. Power’s 2026 property claims study found the average claimant still waited 40.7 days from first notice of loss (FNOL) to final payment. Meanwhile, US billion-dollar disasters have grown from about three a year in the 1980s to nearly 20 a year over the last decade. 2023, 2024, and 2025 brought 28, 27, and 23. In 2025, the average gap between billion-dollar events was 10 days, against 82 in the 1980s.
The traditional sequence is event, FNOL, adjuster dispatch, field assessment, settlement. That sequence was built for a slower calendar. We don’t live on that calendar anymore. At ITC Vegas, I walked insurance leaders through three recent events where carriers closed those gaps. Here’s what claims leaders can take from them.
How catastrophe response has changed
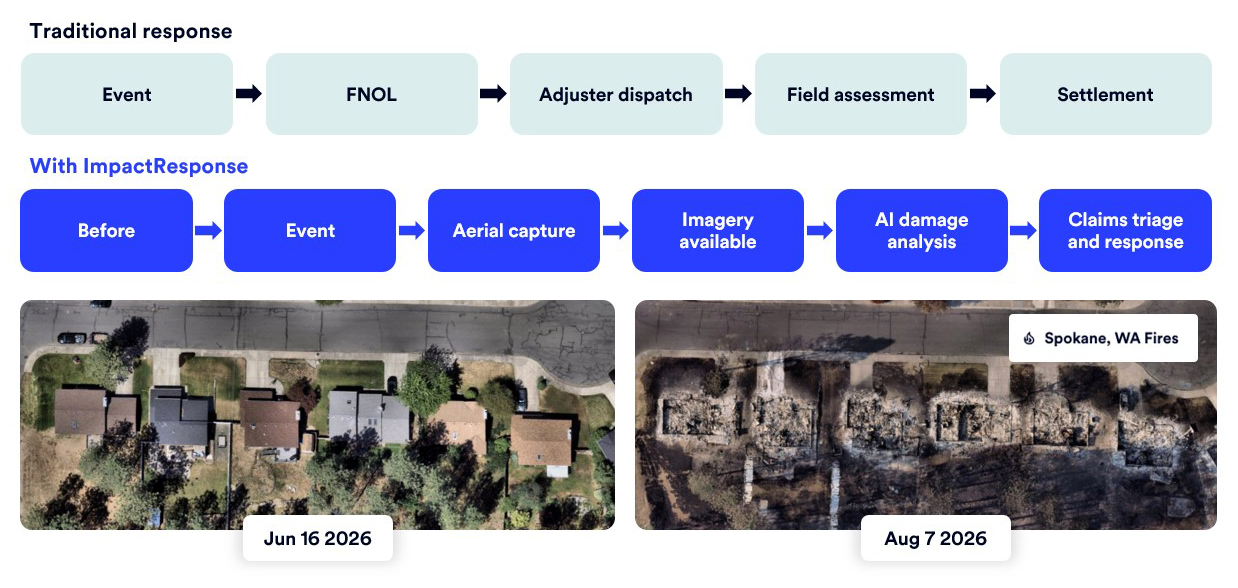
Start before the disaster
Imagery-based claims analysis works best with a recent before image. At both Spokane and Fox Valley, the most recent before image was less than two months old. That matters, because adjusters ask one question again and again: was that damage there before the storm?
Three disasters, three different response challenges
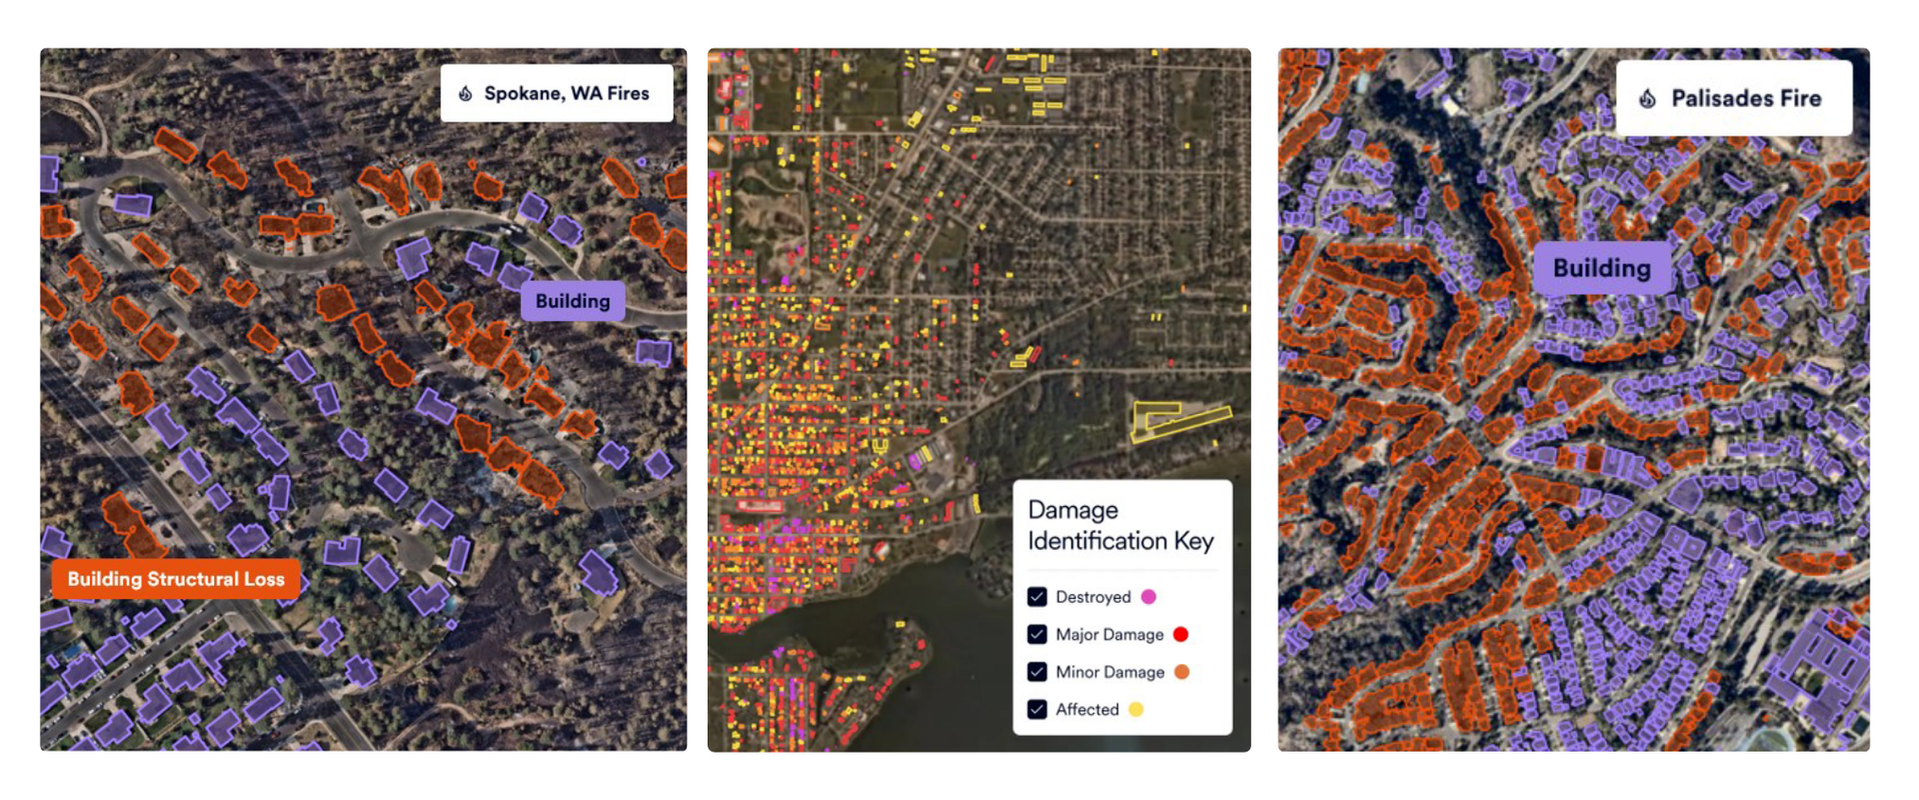
Aftermath of LA fires
1. Spokane, Washington wildfires, August 2026
The challenge: Three fires moving house to house through urban neighborhoods.
What imagery and AI provided: Capture within hours of the fires starting. The AI analyzed 102,532 buildings and identified 853 as completely destroyed.
Why it mattered: Claims teams had building-level damage answers within 48 hours.
2. Fox Valley, Wisconsin tornado, July 2026
The challenge: Separating new storm damage from what was already there.
What imagery and AI provided: First imagery within hours and post-event imagery by the next day. Of 49,123 buildings analyzed, 2,920 had major damage or were destroyed.
Why it mattered: Graded severity against a recent before image gave adjusters a defensible starting point.
3. Los Angeles wildfires, January 2025
The challenge: Scale, extreme winds, and neighborhoods closed to adjusters for weeks.
What imagery and AI provided: The first aircraft was airborne within hours of ignition. Over 22 flights, the AI analyzed 41,116 buildings and found 12,574 with major damage or destroyed.
Why it mattered: Carriers could identify total losses remotely and move claims while access was restricted.
Using AI to understand the full event
Fires and storms don’t hold still, so a single capture rarely tells the whole story. Los Angeles took 22 flights, which let us show not just where damage occurred, but how it changed over time. The AI compares every capture and reports the final condition. People stay in the loop: someone in the aircraft makes sure we cover the right area, and the AI points reviewers to the properties where inspection adds the most value. The AI handles triage. Adjusters still make the hard calls.
Two things keep our aircraft flying when conditions get tough. Our camera optics let us fly higher and cover the same area at the same resolution, which mattered in the Palisades winds. And coordination with public-sector partners, including the Federal Emergency Management Agency (FEMA), helps support capture when airspace and response operations are constrained. Using consistent damage data can help insurers and emergency managers work from a more aligned picture.
Wildfire damage is often more visibly binary from above — a structure is standing or it isn’t — but severity still matters. Storms usually need graded classifications, because severity decides whether a carrier repairs a roof or pays for a rebuild. Our damage classes follow FEMA’s five-tier classification.
It’s a resource allocation game
After a billion-dollar event, the top 10 carriers compete for the same adjusters, contractors, materials, and temporary housing. The carrier that understands the loss first has a real advantage.
During the Palisades fire, I was visiting a carrier that uses our aerial imagery and AI damage analysis in its claims operation. I saw what happened next firsthand. Homeowners had been displaced and neighborhoods were closed for weeks. Adjusters could not always get in. But the carrier could still see which homes were destroyed, make decisions, and move claims forward.
One tier-one property and casualty (P&C) insurer reported that, during the Los Angeles fires, aerial imagery and AI damage analysis helped cut dwelling payment cycle times by half or more. Base-limit payments reached policyholders weeks earlier. The insurer identified total losses remotely, prioritized claims, and sent field adjusters to the complex ones.
Across these events, five things became clear
- A recent pre-event image matters.
- Speed matters, but defensibility matters just as much.
- AI helps triage; people still make the hard calls.
- The same property data should support underwriting, claims, and portfolio management.
- The best claims workflows connect measurement, damage severity, and cost context instead of forcing adjusters to stitch them together manually.
From underwriting to claims
The same property data keeps working after the event. What starts as underwriting context can become claims triage, measurement support, pricing context, and portfolio review. Roof & Exterior Measurements delivers roof area within ±1.6% of manual measurement, verified by Haag Engineering. The goal is to connect measurement and pricing context in one workflow, so adjusters aren’t stitching together separate answers from separate systems.
Before the next event, Portfolio Benchmarking, an add-on to Portfolio Intelligence, compares a carrier’s book with the market using Roof Spotlight Index data across more than 100 million US parcels.
From pricing the risk to paying the claim, the process itself stays the same. What changes is how fast you move between discovery, assessment, and action.
Recent annual totals have reached 23 to 28 billion-dollar disasters, and the average time between events keeps shrinking. The time between discovery, assessment, and action is where the policyholder experience is won or lost. Carriers that build a view of the loss while FNOLs are still arriving decide sooner. And as I learned last Christmas Eve, the policyholder feels every day of that difference.