)
How fragmented property data drives premium leakage and rising claims costs
Premium leakage is the most visible result. It’s not the only one. When insurers are working from disconnected or outdated property intelligence, the cost compounds across your book.
During underwriting, premium leakage shows up at both ends of the book. At new business, policies are priced on conditions that may be months or years out of date. A new outbuilding.
Solar panels installed last summer. A roof already showing wear. None of it visible to the underwriter.
At renewal, properties that have deteriorated or expanded are renewed at rates that don’t reflect current risk.
)
At claims, fragmented property data shows up in loss adjusting expense. Teams spend their time reconciling conflicting sources instead of making decisions. Claim disputes take longer and loss adjusters visit properties that could have been triaged remotely.
What the data showed when the hailstorm hit Redland Bay
The November 2025 SE QLD hailstorm is a clean proof of concept.
)
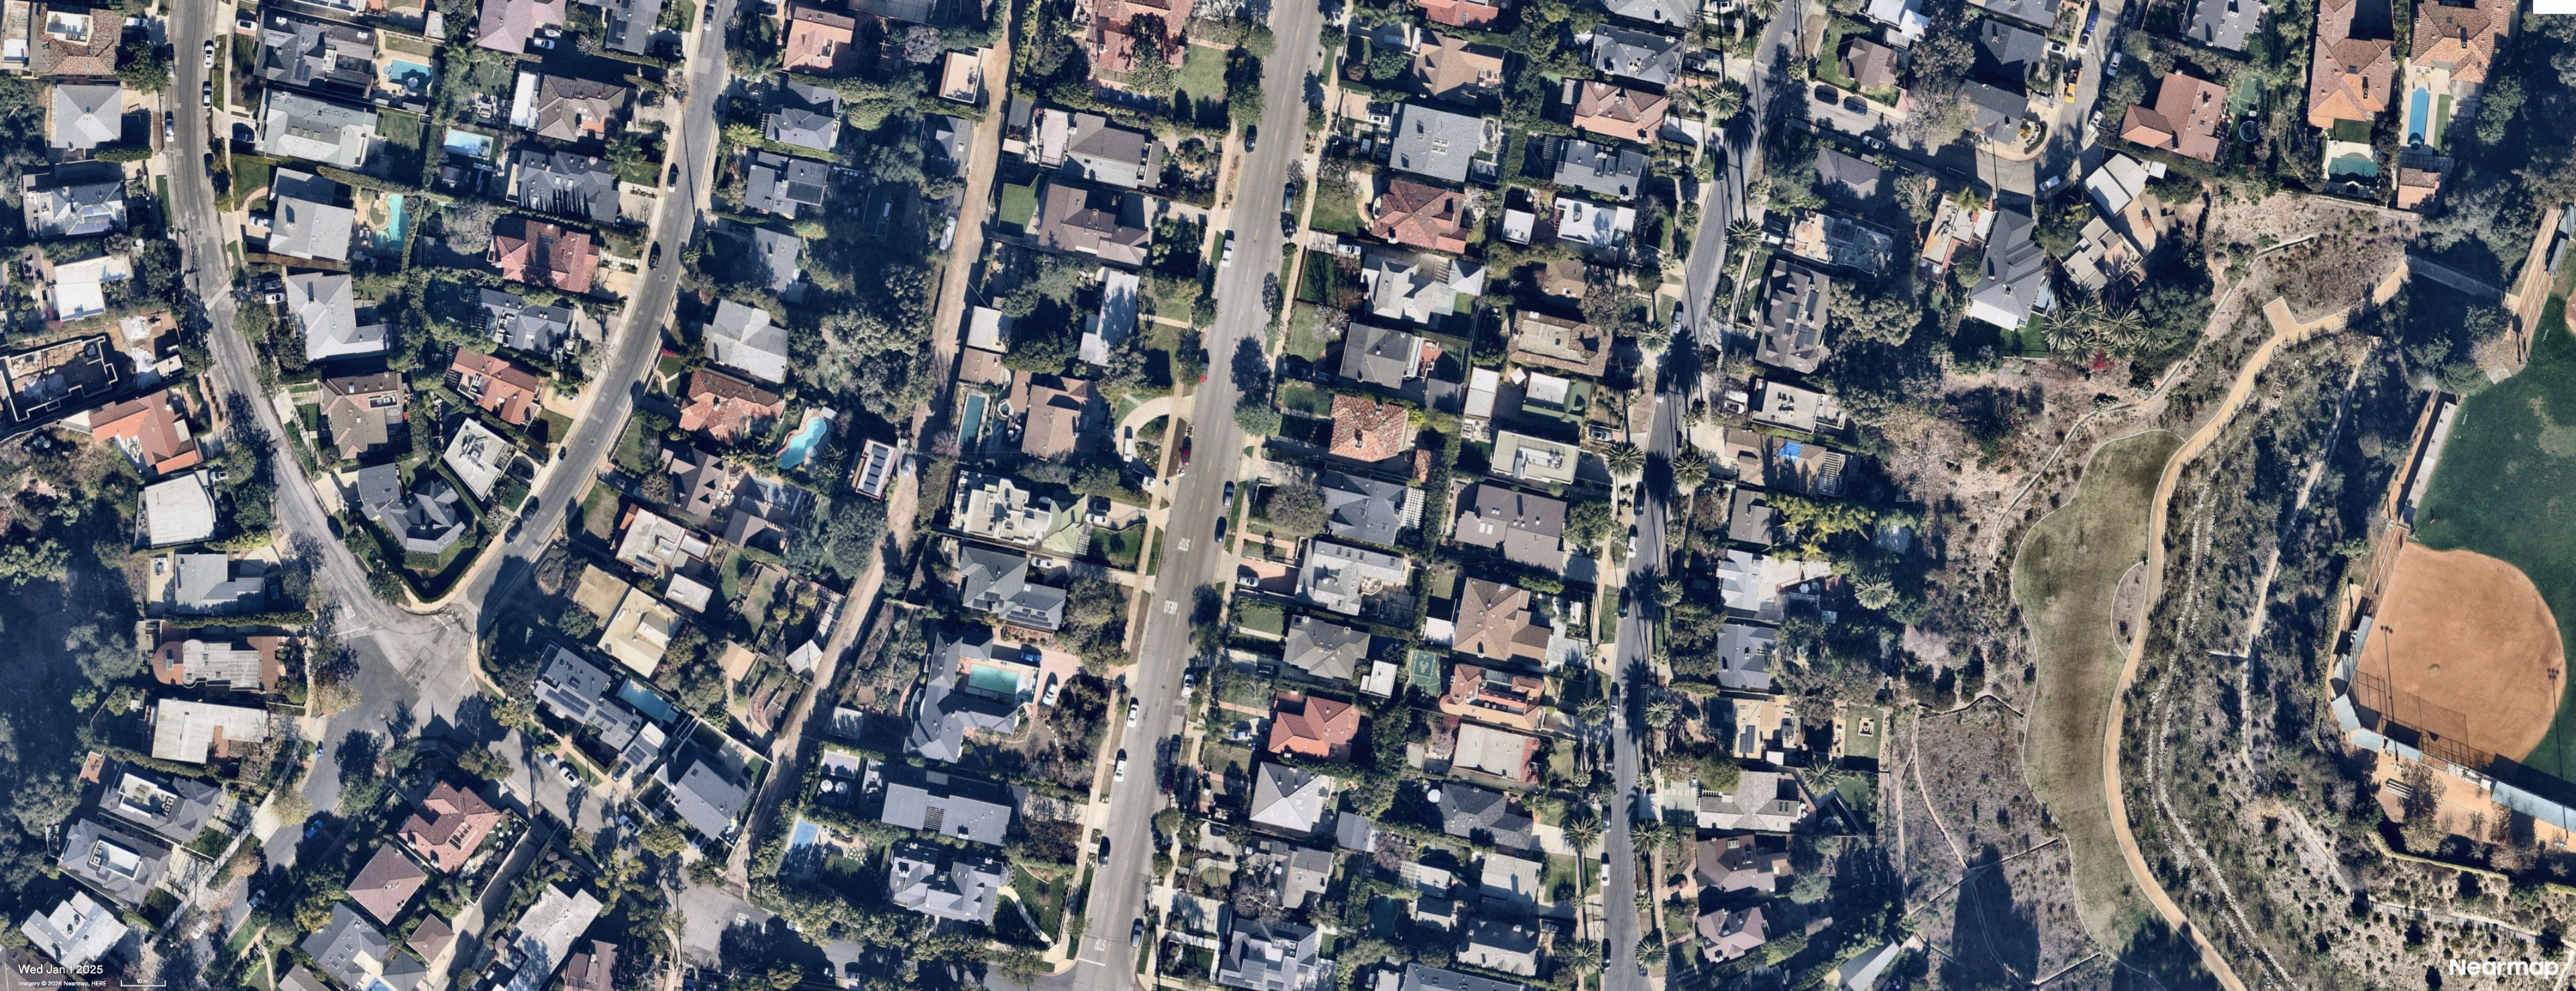
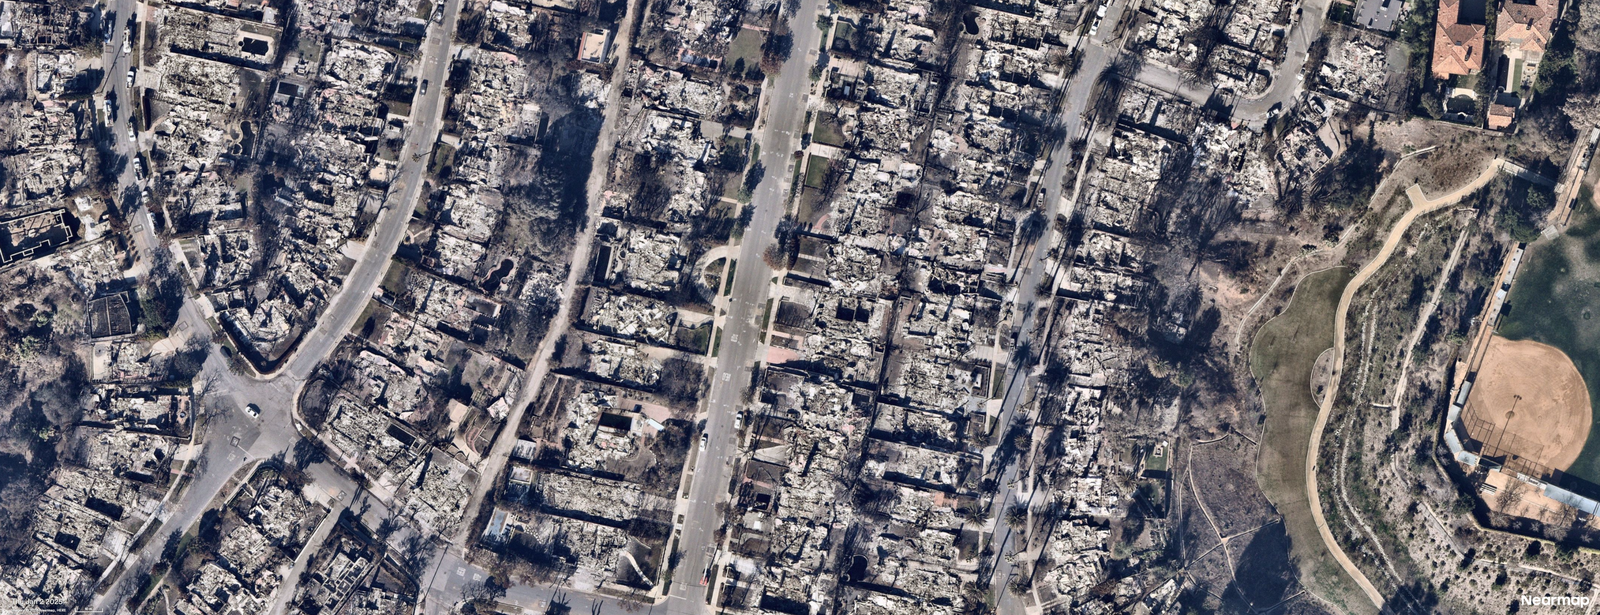
Aftermath of LA fires
Across approximately 106,000 roofs in the Redland Bay region, the data tracked property condition before the event, immediately after, and through recovery to March 2026. The damage pattern that emerged wasn’t random.
Two properties, 11 metres apart, same street, same storm. Pre-storm Roof Spotlight™ Index (RSI): 78 versus 97. Post-storm: 9 versus 98.
One roof was tarped within days. The other came through undamaged. The pre-storm condition called it.
Across the full dataset, roofs with a pre-storm RSI below 70 were roughly 7 times more likely to end up tarped than those in good condition. An underwriter monitoring those properties would have had three clear options before the next renewal date: cancel the policy, schedule an inspection, or adjust the premium.
The full workflow is connected. This enables team to reliably flag property changes, track deterioration, trigger peril and weather alerts, and act through cancellation, inspections, and premium adjustment.
How vulnerability scores help you prepare for CAT response
Those same pre-event insights improve day-to-day claims decisions. And they become critical when a CAT event hits.
Vulnerability scores based on pre-event imagery enable claims teams to prepare resources, predict losses and reserves, and communicate with policyholders before a single claim is filed.
When the November hailstorm hit Redland Bay, tarped roofs jumped from a baseline of 48 to 131 within 48 hours of the event, and peaked at 191 a week later. Structural damage detections moved from 47 to approximately 330 in the same window.
)
What 54% more solar panels and 12% more pools means for your sum insured exposure
The financial logic is straightforward. AI-derived property insights cover 130+ characteristics per property (e.g., roof condition, structural deterioration, defensible space, property objects). Updated multiple times throughout the year, they make your decisions not just accurate, but defensible.
In Redland Bay, between 2020 and 2025, solar PV installations increased by 54%, from 348 to 514 per 1,000 roofs. Swimming pools increased by 12%. Neither change shows up reliably in customer disclosure at renewal. Across 106,000 properties, that’s a material shift in sum insured exposure. Invisible to any insurer not monitoring their portfolio.
Tile roofs were 2.4 times more likely to be tarped than metal roofs under equivalent storm exposure. That’s a segmentation variable that existed in the property data before the storm arrived, and it has direct implications for pricing accuracy across any hail-exposed book.
The cost is already in your P&L. The question is whether it’s traceable.
Insurers that have made the shift to current, imagery-verified property data are making sharper decisions — on pricing, at renewal, and when claims arrive. Insurers that haven’t are absorbing the same costs, distributed across the P&L in ways that are harder to attribute.