Claims teams response after the Fox Valley tornado
The Fox Valley tornado hit 49,123 buildings. Here’s how claims teams responded.
)
On July 27, 2026, a tornado cut through Fox Valley and Menasha, Wisconsin. By the next morning, claims teams writing policies in that footprint faced the same problem every major weather event creates: tens of thousands of properties potentially damaged, FNOL volume building fast, and no clear picture of where the worst of it landed.
That problem used to be extremely manual and slow. After Fox Valley, it took 24 hours.
Speed is step one
When a tornado hits a densely populated corridor, the first 48 hours are critical: insurers need to know where to send a finite amount of adjusters. The properties that need them most aren’t necessarily the ones that called in first.
Three aerial surveys of the Fox Valley and Menasha area were completed on July 28, covering approximately 46 square miles. The first imagery was available at 11:21 a.m. CDT. before most carriers had processed a fraction of their FNOL volume.
Claims volume after a CAT event fluctuates, and doesn’t map to case severity. Getting overhead visibility across the full footprint while inbound volume is still building is the difference between managed triage and reactive dispatch.
Every damaged roof has its own risk profile
The Fox Valley analysis broke damaged structures into categories, revealing patterns the total count alone couldn’t show:
Menasha WI, by the numbers
99,800
49,123
5,565
2,980
Nearmap AI examined approximately 99,800 mapped structures across the surveyed area. After filtering for primary structures and detection confidence, the analysis focused on 49,123 buildings and classified each one by damage severity. Of those, 5,565 showed instantly, visible signs of damage. Within that group, 3,225 were primary structures (main homes and commercial buildings), and 2,920 had sustained major damage or were completely destroyed.
That last number is what changes how a claims operation runs. Of all the buildings in the footprint, 11% showed visible damage. But within that 11%, the majority of damaged primary structures were in the highest severity tier. The total loss and major damage concentration wasn’t random, it tracked a corridor, and that corridor was visible in the imagery the morning after the storm.
)
For a claims team managing inbound volume from across the footprint, that visibility is actionable in a specific way: total losses can be identified and fast-tracked before they’re reported; adjusters can be deployed to the properties that actually require them; and the properties in the minor or “affected” tier can be handled differently. Whether that’s desk reviewed, virtually assessed, or prioritized for later, rather than absorbing field capacity that should be going elsewhere.
The before image is half the claim
The May 10, 2025 capture of the Fox Valley area existed before the tornado struck. When the July 28 imagery came in, claims teams had a before-and-after comparison from the same capture program, processed to the same standard. That consistency is what makes the comparison defensible.
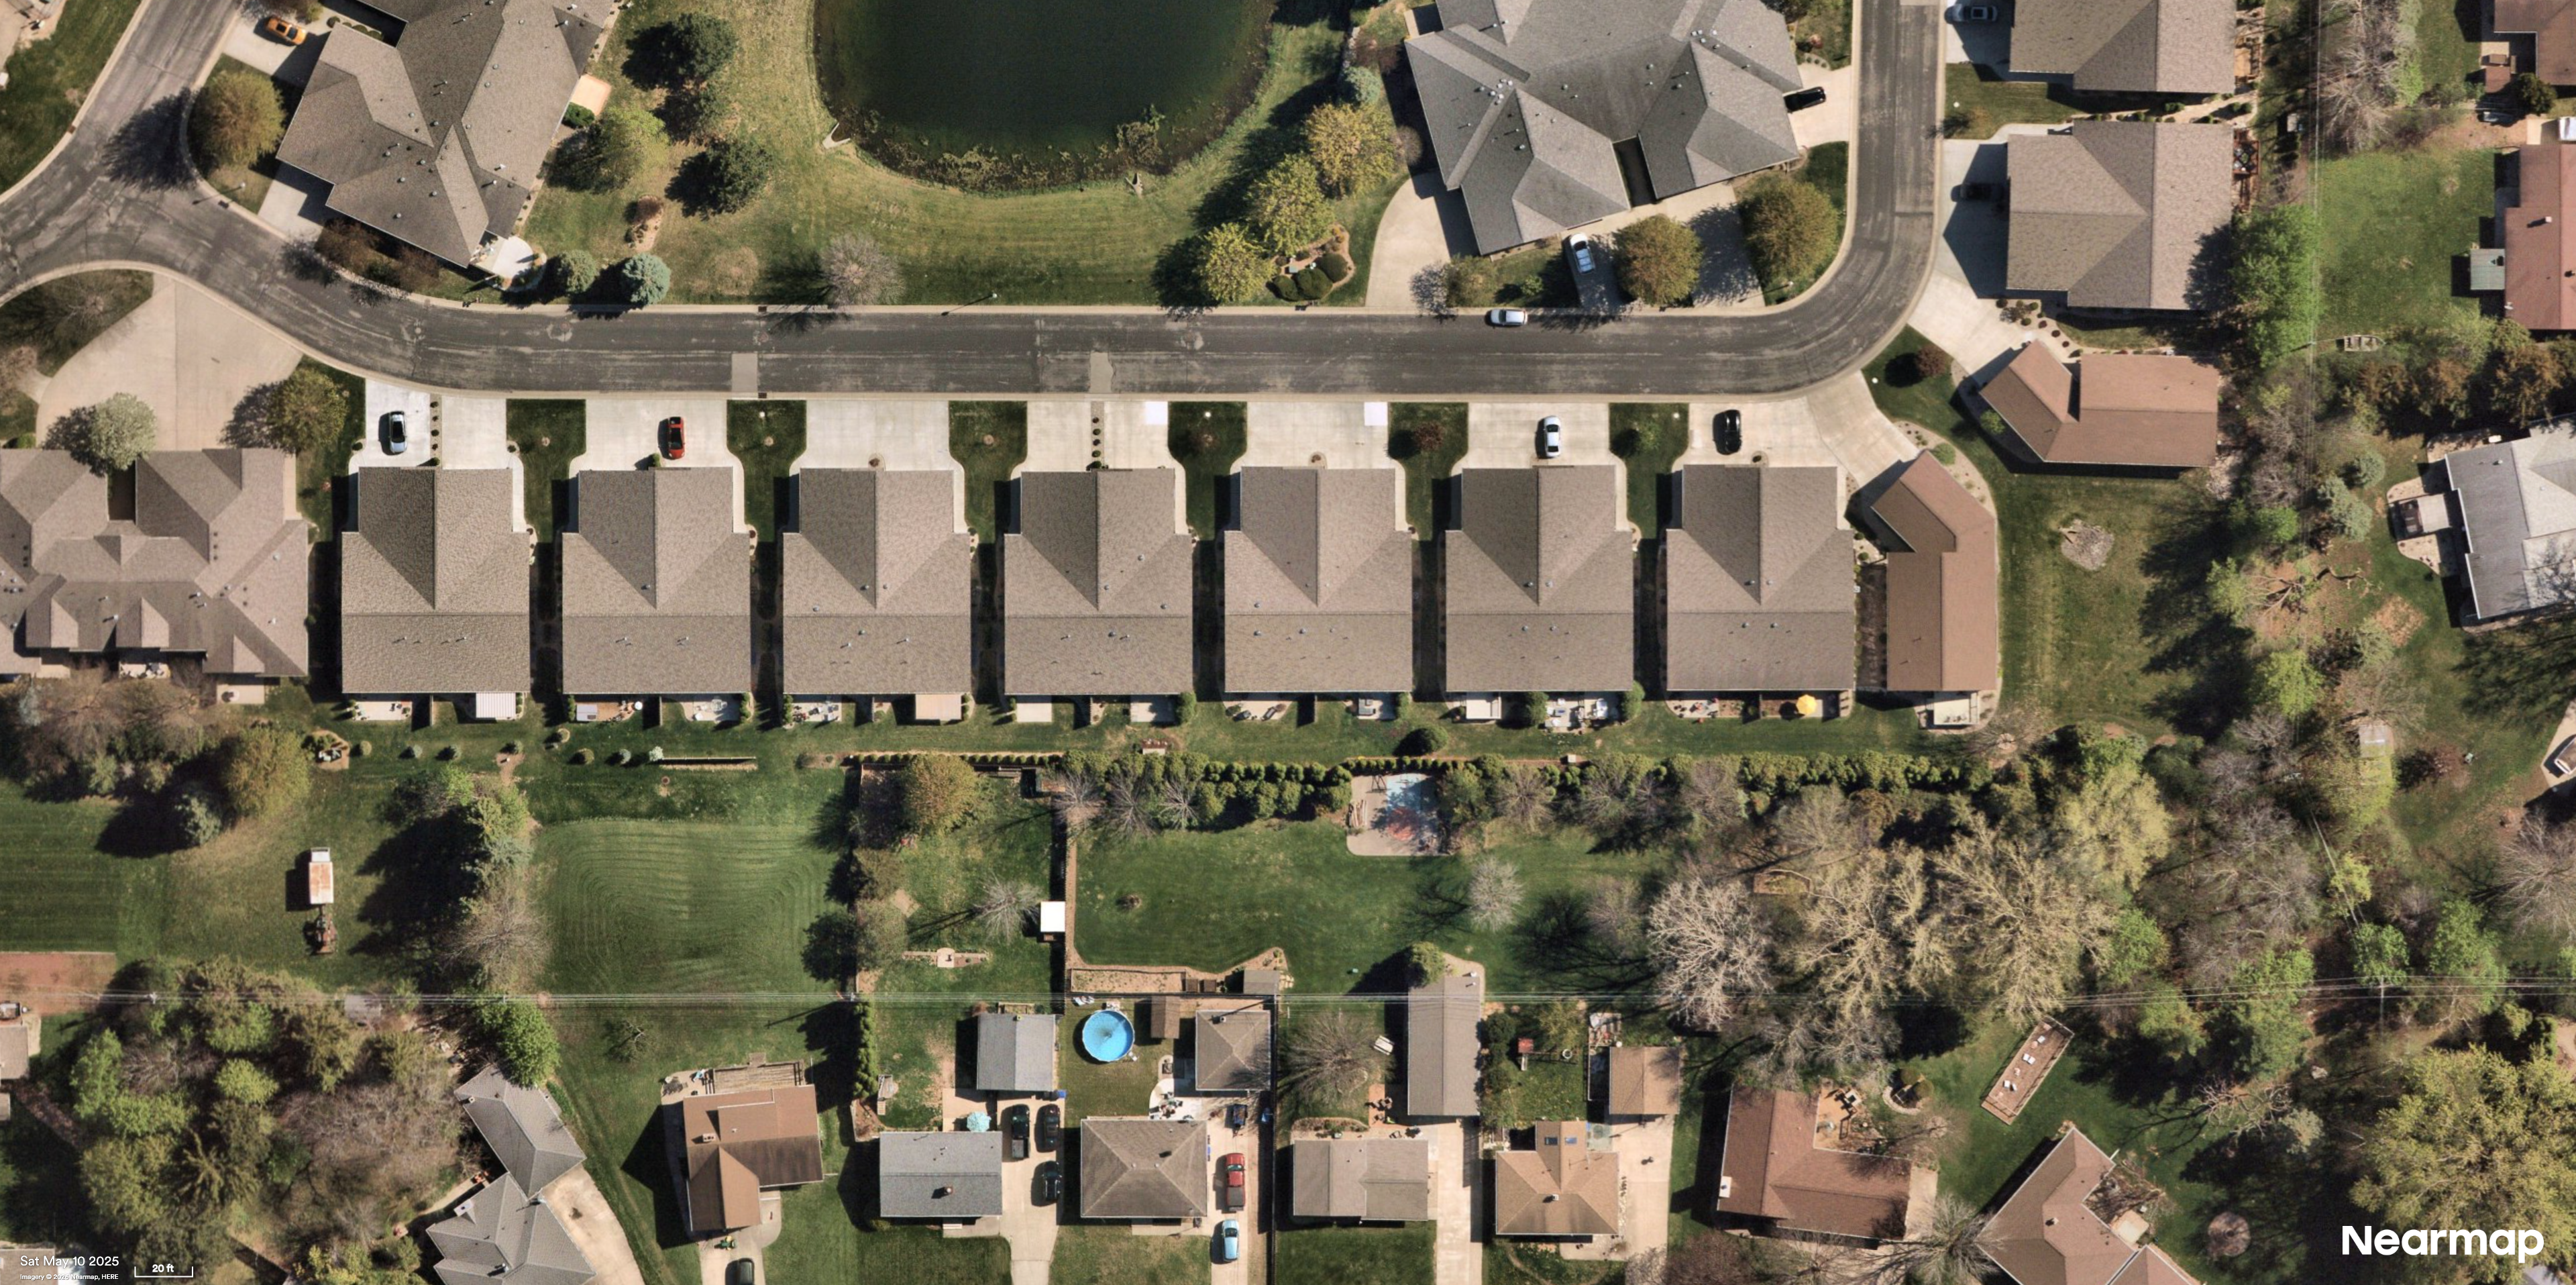
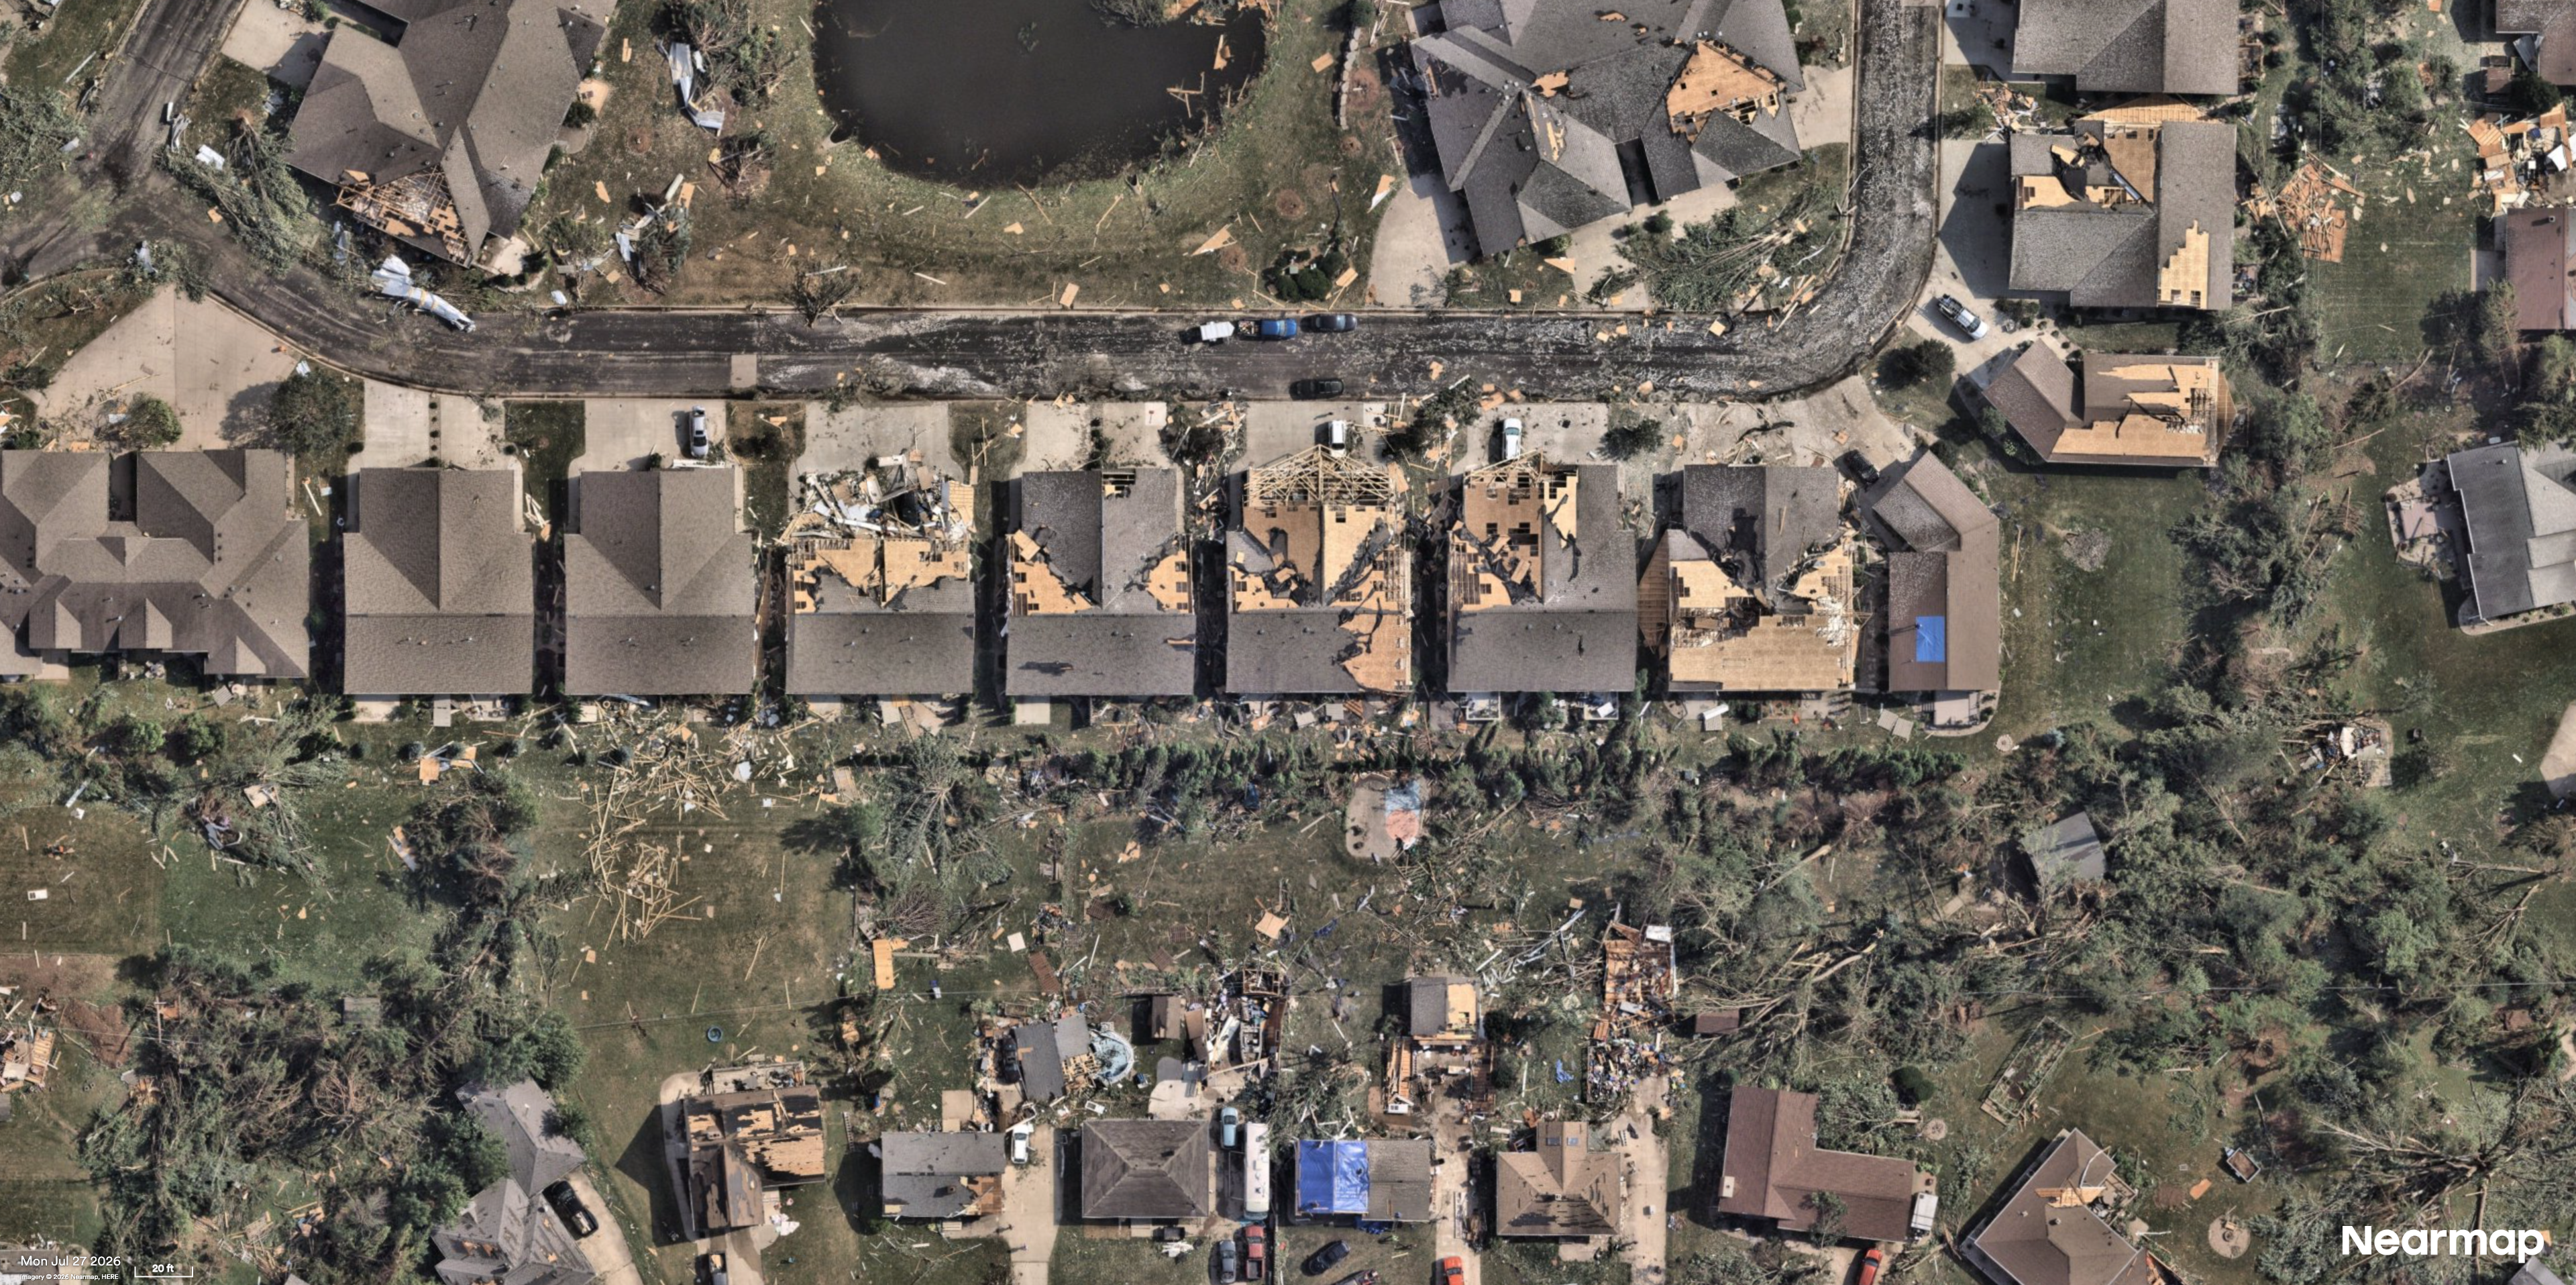
Every contested claim involving storm damage eventually arrives at the same question: was this caused by the event, or was it pre-existing? The answer is only as good as the evidence available from before the storm. When that evidence comes from a different source, a different resolution, or a different methodology, it creates an opening for dispute. When it comes from the same program, that opening closes.
The same pre-event baseline that supports dispute resolution also supports reserving. When the damage classification for a structure is visible and documented (destroyed, major damage, minor damage, affected) setting initial reserves becomes a calibrated decision rather than an estimate built on exposure modeling alone.
When scale is non negotiable
The Fox Valley event is a contained example of a challenge that plays out at far greater scale during hurricane season or multi-state hail events. The operational logic is the same: the claims teams that know where severity is concentrated before adjusters are deployed make better decisions about where those adjusters go. And the ones that can produce a defensible before-and-after record at the property level spend less time in supplement disputes.
Post-CAT claims response has historically been sequential, wait for FNOL, dispatch, assess, settle. Aerial damage analysis at speed doesn’t change the sequence. It compresses the gap between the first step and the last one.