
See every property before the first fire
The Bureau of Meteorology declared El Niño in June, and AFAC has raised fire potential across most of Australia. The forecast is set. What’s still open is how clearly you see the properties you’re carrying.)
Weather and exposure decide where a fire starts and how far it runs.
Once the front arrives, the vulnerable home and the resilient one beside it fare very differently. We flew the Victorian fire ground before the season and again after.
The most recent read we have: Victoria 2026
0
0
0.0
x
0
hrs
Get the report
See what separated the vulnerable homes from the resilient ones in our El Niño 2026 report. Plus, get exclusive insights to help you prepare for the season ahead.
)
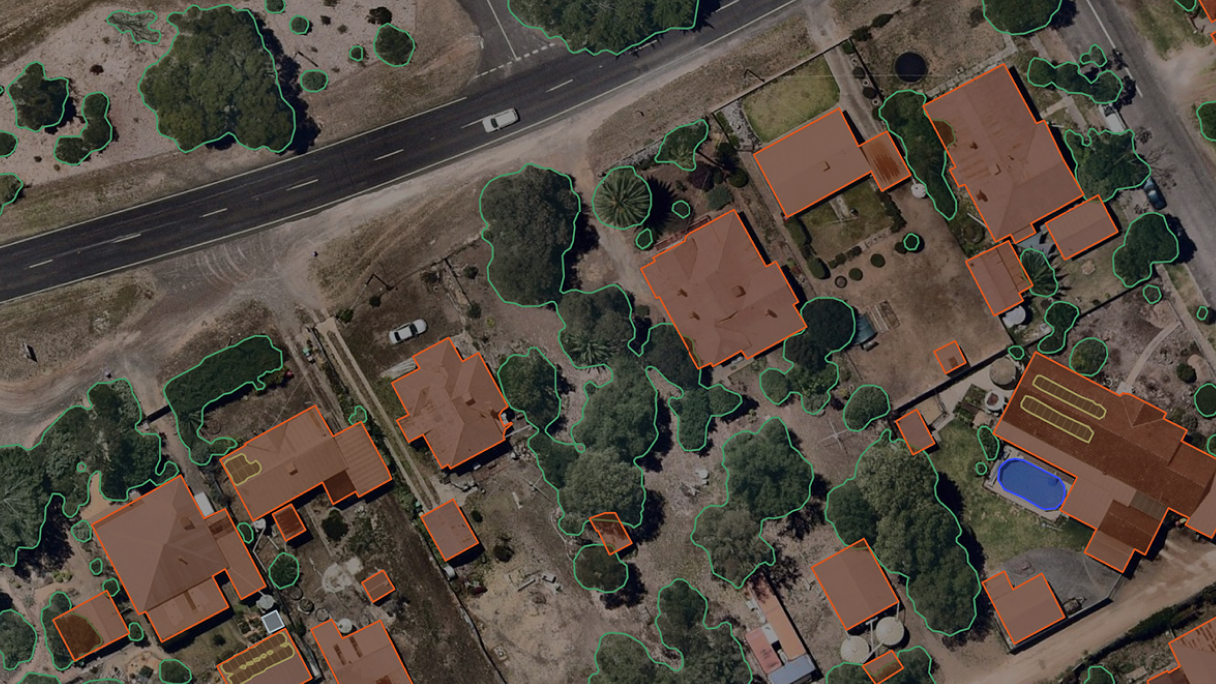
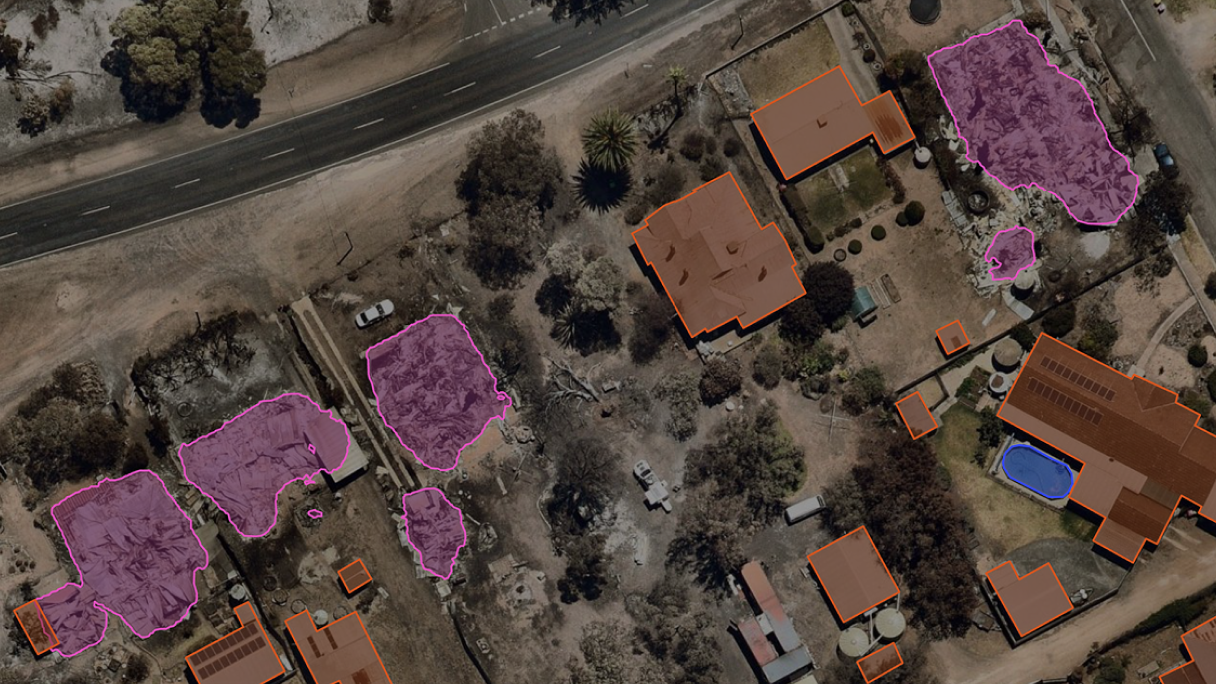
The same property, six weeks apart.
Every building in the footprint was classified as destroyed, damaged, or untouched from imagery, before ground crews could reach most of it.
What you will learn

Which homes carry the risk inside a flagged corridor
What the intelligence showed about the homes that survived, the ones that didn’t, and how narrow the gap between them turned out to be.

How to read damage before anyone reaches the ground
36,012 buildings classified across the footprint from a desk, in days, while access was still closed.

What's still open before the first fire
How to rank the properties inside a flagged corridor, which homes are worth a clearance conversation, and what the data can and can’t carry into a rating decision.
Keep reading
)
Nearmap ImpactResponse
Post-event imagery within 24-48 hours of capture, five-tier damage classifications, and portfolio-wide loss estimates. This is how insurers stage teams, triage adjusters, and reach policyholders before FNOL.
Learn More)
Victoria 2026 from above
Aerial captures from Longwood, Ravenswood, Streatham, Harcourt and Yarroweyah, taken weeks apart. Victoria's worst fire danger day since Black Summer, in imagery.
See The Captures)
Nearmap Peril Risk
Peril vulnerability scores built on AI detections including roof condition, roof material and defensible space. Get the pre-event read that ranks properties inside a corridor.
Learn More