
Site location analysis has always been a powerful weapon for commercial businesses in search of the optimal location. It’s always used a blend of demographic and geographic attributes to target specific populations, buying power, growth trends, competitor locations, road networks and more
The difference today is specificity. In years past, the unit of analysis for site location specialists were zip codes and census geography classified by lifestyle type, median income, home values and other socio-economic indicators.Today, the game has changed driven by new forms of data – instantly accessible in the cloud. Rather than look at macro trends for areas encompassing dozens to hundreds of homes, what if you could visualise the precise details of every roof in high resolution? What if you could do this from your desktop or mobile device and measure dimensions, see shadows, pinpoint height, identify obstructions and direct your sales teams?
Aerial imagery has changed the game for hundreds of solar companies focused on either growing their regional business or bursting onto the national scene. What is aerial imagery? How does it differ from other forms of imagery? How are solar companies using it as a competitive advantage today?
Aerial imagery are photographs taken from fixed wing aircraft. They typically offer far greater resolution than satellite imagery and far wider coverage than localised drone imagery. From a bird’s eye perspective, fleets of planes flying back and forth on clear, cloudless days capture 2.8” GSD aerial maps that reveal the details solar companies need to target residential and commercial properties. This form of imagery is especially relevant based on a few factors including recency, clarity and change over time. Visualising perfectly clear imagery captured last month or last week provides and unprecedented level of confidence to run your business. Comparing that imagery to older imagery is useful in seeing change over time, especially when the captures include both leaf-on and leaf-off imagery used to calculate energy utilisation and efficiency.
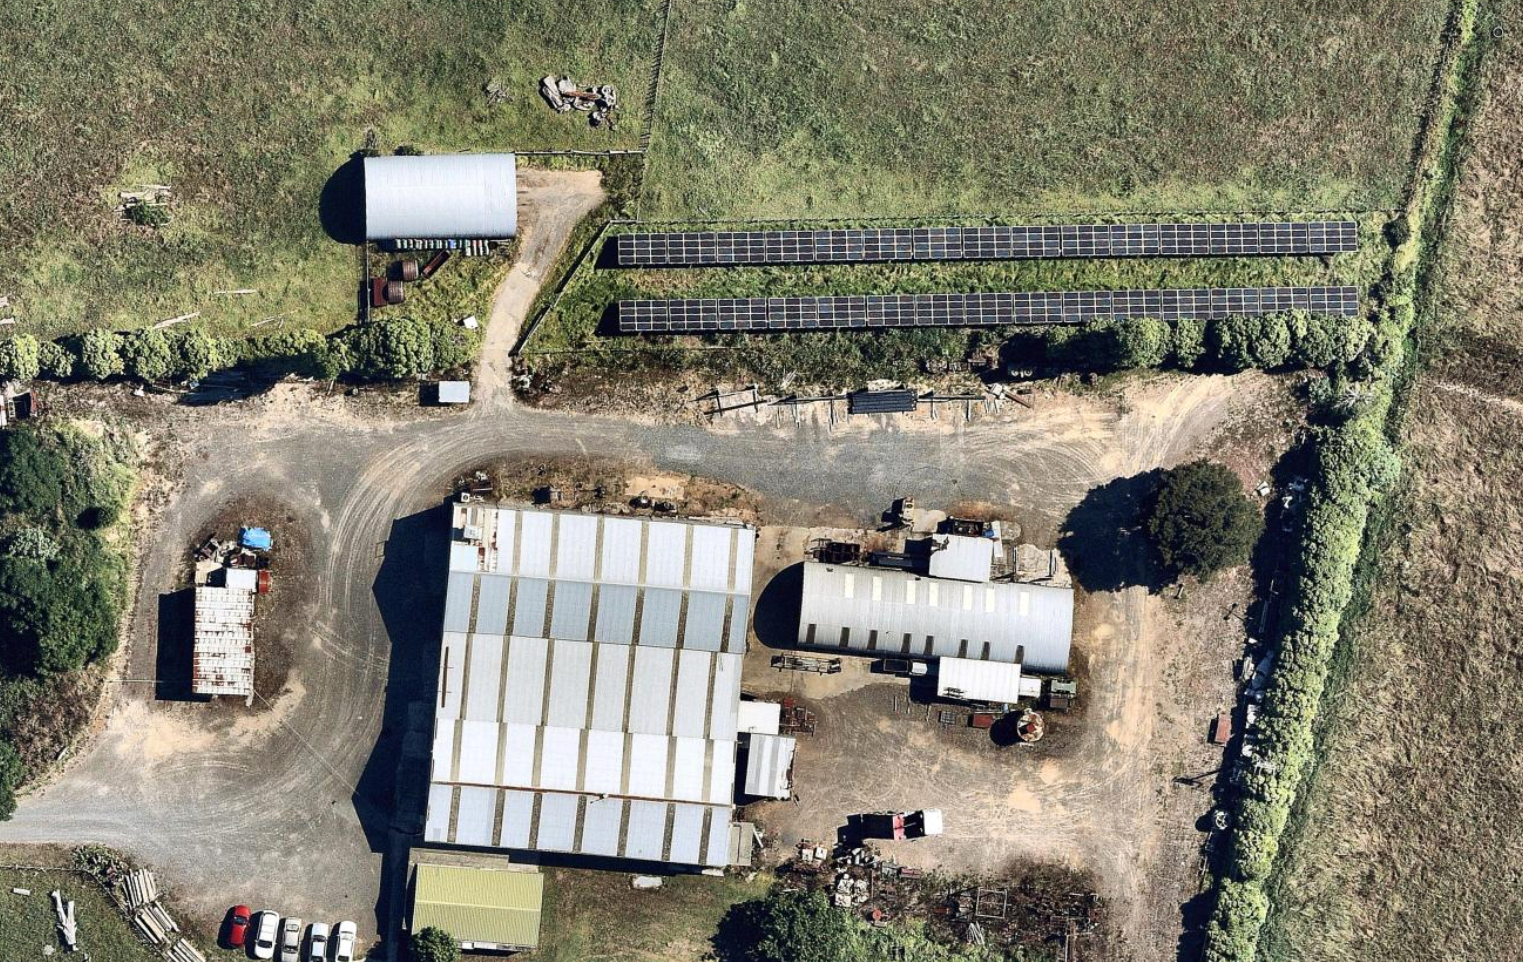
Solar Panel Install in Auckland; Captured February 2019
Rather than spend time and money deploying sales people into the field on a mission of discovery, solar companies are taking a more direct, targeted approach. They analyse aerial maps from the confines of their offices, size up locations, measure height, model panel installations and deploy their sales teams to specific properties that meet their qualifying criteria. And rather than build proposals with fuzzy imagery, they include high res images and, in so doing, yield higher levels of accuracy and consumer confidence in the product. These same companies and saving time and money with precise calculations that consider roof obstructions leading to order efficiency, jobs completed on time and higher levels of customer satisfaction.
To make this all possible, vendors need to not only capture the imagery for large areas across New Zealand, but also process it, stitch it together and deliver seamless maps in the cloud. In many instances, solar companies want to embed the imagery inside purpose built applications – with their own, or 3rd party solutions – designed to derive meaningful metrics about solar panel performance.
Site location analysis has taken on new meaning. Innovation in camera systems, fast aerial surveys, cloud-based processing pipelines, managing massive amounts of mapping data and reality-based imagery in the cloud are all transforming the way solar companies work. In this business, the details matter. Visualising truth on the ground has become the catalyst for solar companies to expand rapidly, optimise their resources and grow at rates that manual approaches simply do not allow.