Before the next event: geospatial intelligence for disaster management


How aerial technology and AI-powered geospatial data are equipping Australia’s emergency leaders with the data to prepare for, respond to, and recover from an intensifying disaster landscape.


hero-image

Executive summary


In 2025, natural disasters cost the Australian insurance industry $4.8 billion in insured losses across 294,000 claims, a 727 per cent increase on 2024’s $585 million.2 The total economic cost of the year’s events, including uninsured losses, is estimated at more than $8.6 billion.2 Ex-Tropical Cyclone Alfred, once the year’s costliest event, was ultimately overtaken by the November Queensland and New South Wales storm and hail event, which reached $1.78 billion across nearly 93,000 claims.2
This was not an outlier year. It was a preview of what is coming.
Natural disasters now cost Australia $38 billion a year on average. By 2060, that figure is projected to reach $73 billion.1 Every successive review, royal commission, and independent inquiry has reached the same conclusion: Australia overinvests in rebuilding after disasters and underinvests in preparing for them.6,8
CSIRO research finds that every dollar invested in disaster risk reduction saves between $2 and $11 in future recovery costs.4 The technology to act on that finding exists today, and it is already deployed inside Australian government: from council assessment teams to state environmental agencies. This paper makes the case for that shift, with Australian organisations already using it to reduce field work, speed disaster response, and defend funding decisions.

The cost of the status quo

$38 billion a year and rising

On a Friday in March 2025, ex-Tropical Cyclone Alfred made landfall near the Gold Coast, the first tropical cyclone to reach that stretch of coastline in more than 50 years. One year on, insurer data puts Alfred’s toll at roughly $1.5 billion in insured losses and an estimated $2.7 billion in total economic cost.3
Alfred was one of four insurance catastrophe events and four significant weather events declared by the Insurance Council of Australia in 2025, a year that produced $4.8 billion in insured losses from 294,000 claims. The year before? $585 million. The year before that? $2.35 billion.2
Year
Insured losses
Key events

2023

$2.35 billion

Cyclone Ilsa, the River Murray floods, and Cyclone Jasper

2024

$585 million

Cyclone Kirrily and Victorian storms

2025

$4.8 billion

Ex-TC Alfred, North Queensland floods, and record Q4 storm and hail losses

Since 2022, severe and catastrophic weather events have generated $15.4 billion in insured losses nationally, with total economic costs estimated at around $28 billion.2 A Deloitte report commissioned by the Australian Business Roundtable puts the fuller figure, including uninsured losses, mental health impacts, housing displacement, and lost productivity, at $38 billion a year today, rising to $73 billion by 2060. Two-thirds of that growth falls on Queensland and New South Wales.1
The Climate Change Authority’s 2025 Home Safe report adds a household lens: bushfires, cyclones, and floods cost Australian homeowners approximately $4 billion a year in cleanup and recovery, projected to reach $8.7 billion by 2050.4 A separate 2025 Deloitte report for UNICEF Australia found disasters cost children and young people $6.3 billion a year now, rising 65 per cent to $10.4 billion by 2060,5 a reminder that disaster planning decisions carry consequences well beyond the immediate response window, for the school, housing, and family service agencies that absorb them.
North Queensland Flood

Ayr QLD

Built for how the Australian government operates and buys

The case for better geospatial data in disaster planning and response does not compete for budget against “business as usual.” It competes against the daily reality that councils and agencies are doing more with less: ageing infrastructure, growing populations, and constrained staff and budgets are already stretching field-first workflows past their limit, before a single disaster incident hits.
The Disaster Ready Fund and state-level resilience programs are accelerating investment in mitigation and emergency response, and Nearmap is already accessible to Australian government buyers through standard state and local government supplier panels and whole-of-government procurement arrangements, so agencies do not need to run a full tender from scratch to get started.
That combination, growing pressure and existing procurement pathways, is why geospatial intelligence is shifting from a specialist GIS tool to a shared operating picture used across planning, public safety, assessment, and recovery teams within the same council or agency.

The investment that pays for itself

Every dollar invested in disaster risk reduction saves between $2 and $11 in future recovery costs

The Productivity Commission has put it bluntly: governments overinvest in post-disaster reconstruction and underinvest in planning and mitigation efforts that would limit the impact of disaster incidents in the first place.6 CSIRO research quantifies the return: every dollar invested in disaster risk reduction saves between $2 and $11 in future recovery costs.4
The Disaster Ready Fund is investing up to $1 billion over five years in resilience and risk reduction. Round Three delivered $200 million across 96 projects for 2025-26.7 Round Four, which closed for applications on 1 July 2026, makes up to $142.477 million available for 2026-27, with part of the allocation now reserved for national capability programs.7 Agencies should expect future rounds to be more competitive, which raises the value of applications backed by defensible, current evidence of risk and exposure rather than estimates.

The intelligence gap


Three barriers to better outcomes

Successive reviews, including the Royal Commission into National Natural Disaster Arrangements and the Productivity Commission’s inquiry into disaster funding, point to the same three barriers.8,6
  1. Fragmented data: after a major event, responders, councils, and state and federal agencies each bring their own data sources and formats, and time spent reconciling them is time not spent acting.
  2. Limited visibility at the moments it matters most: before, during, and after a disaster, decisions rely on incomplete intelligence without current, high-resolution imagery at each stage.
  3. Structural coordination gaps: Australia’s federated emergency management system requires shared situational awareness that inconsistent access to hazard mapping and monitoring undermines.
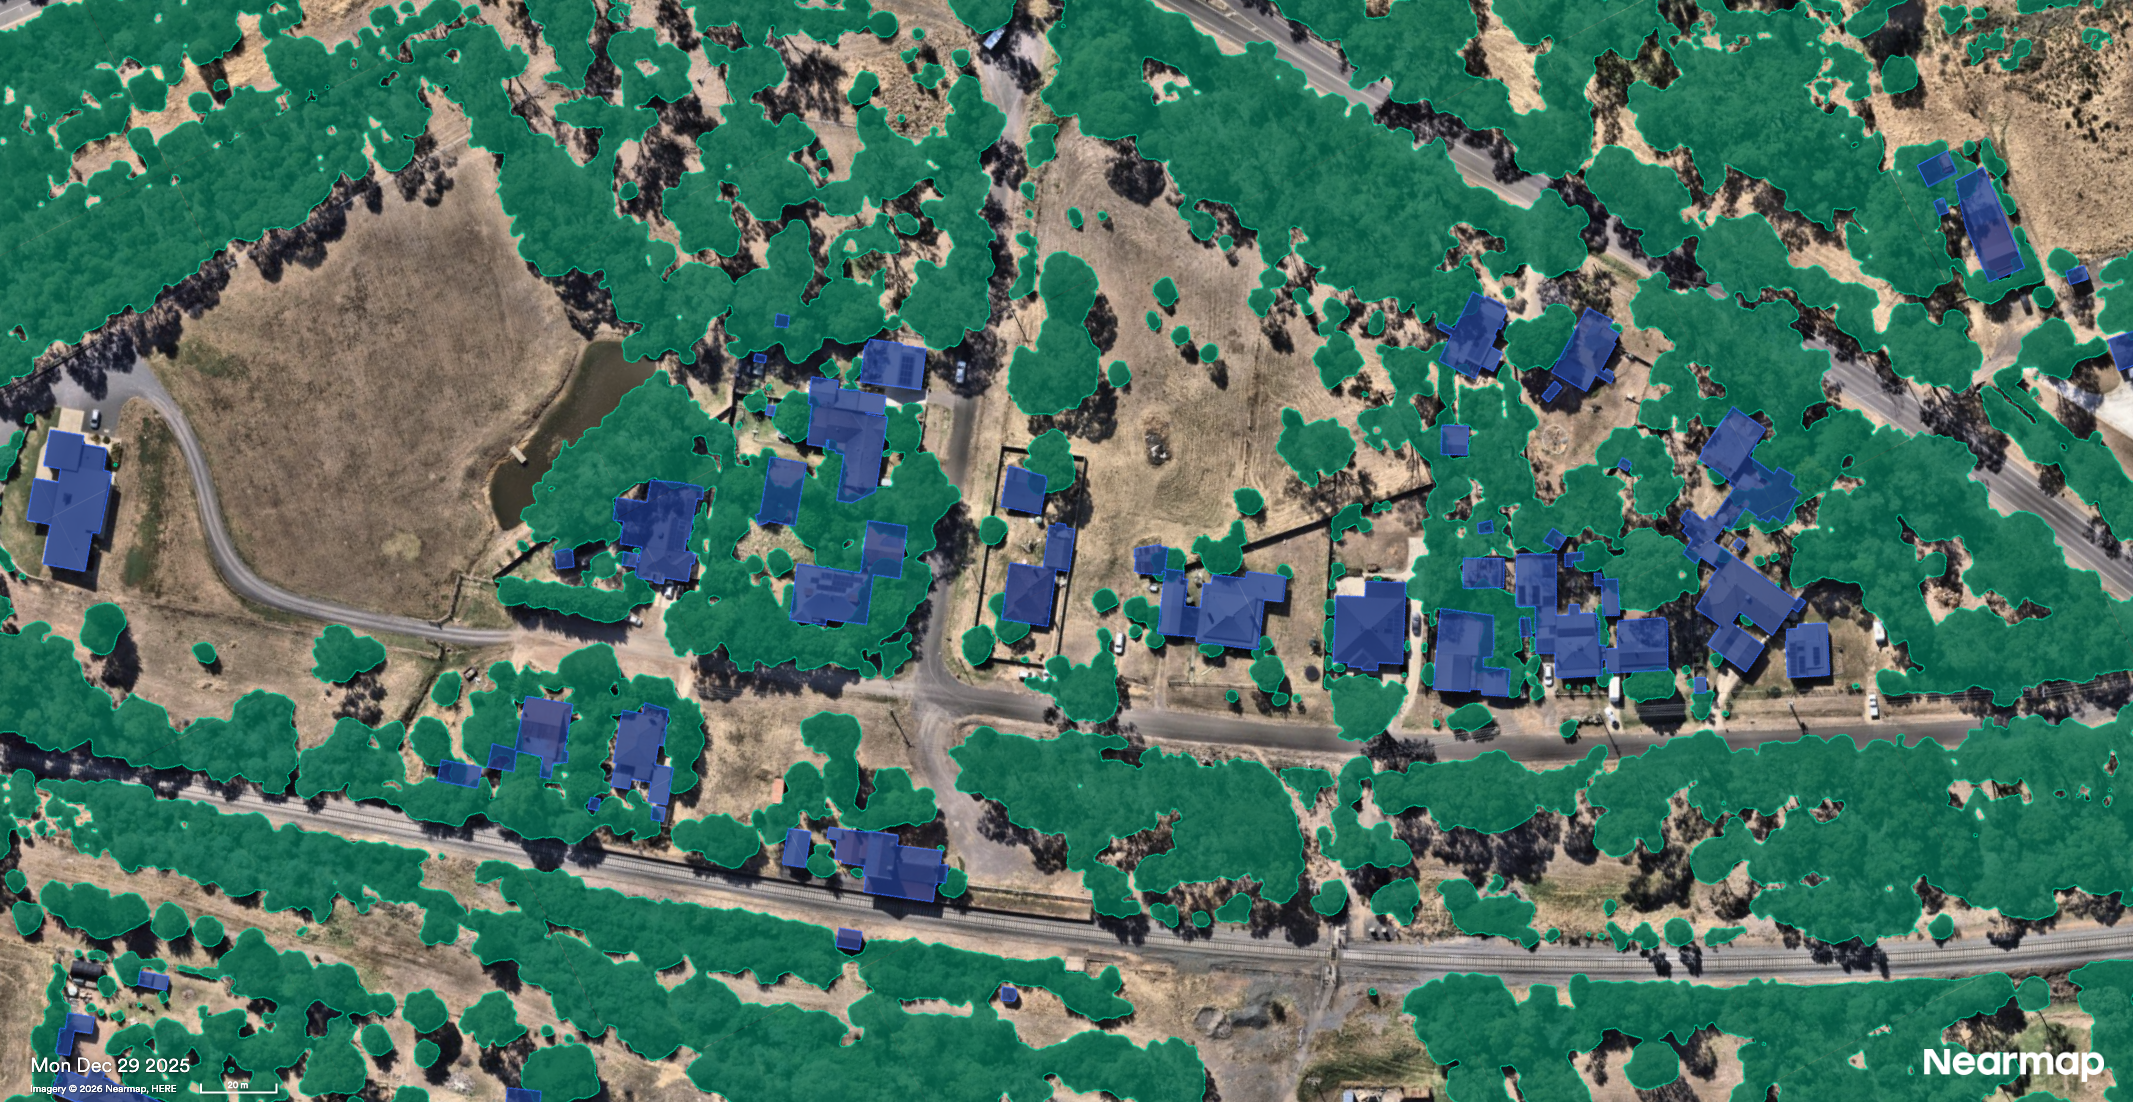
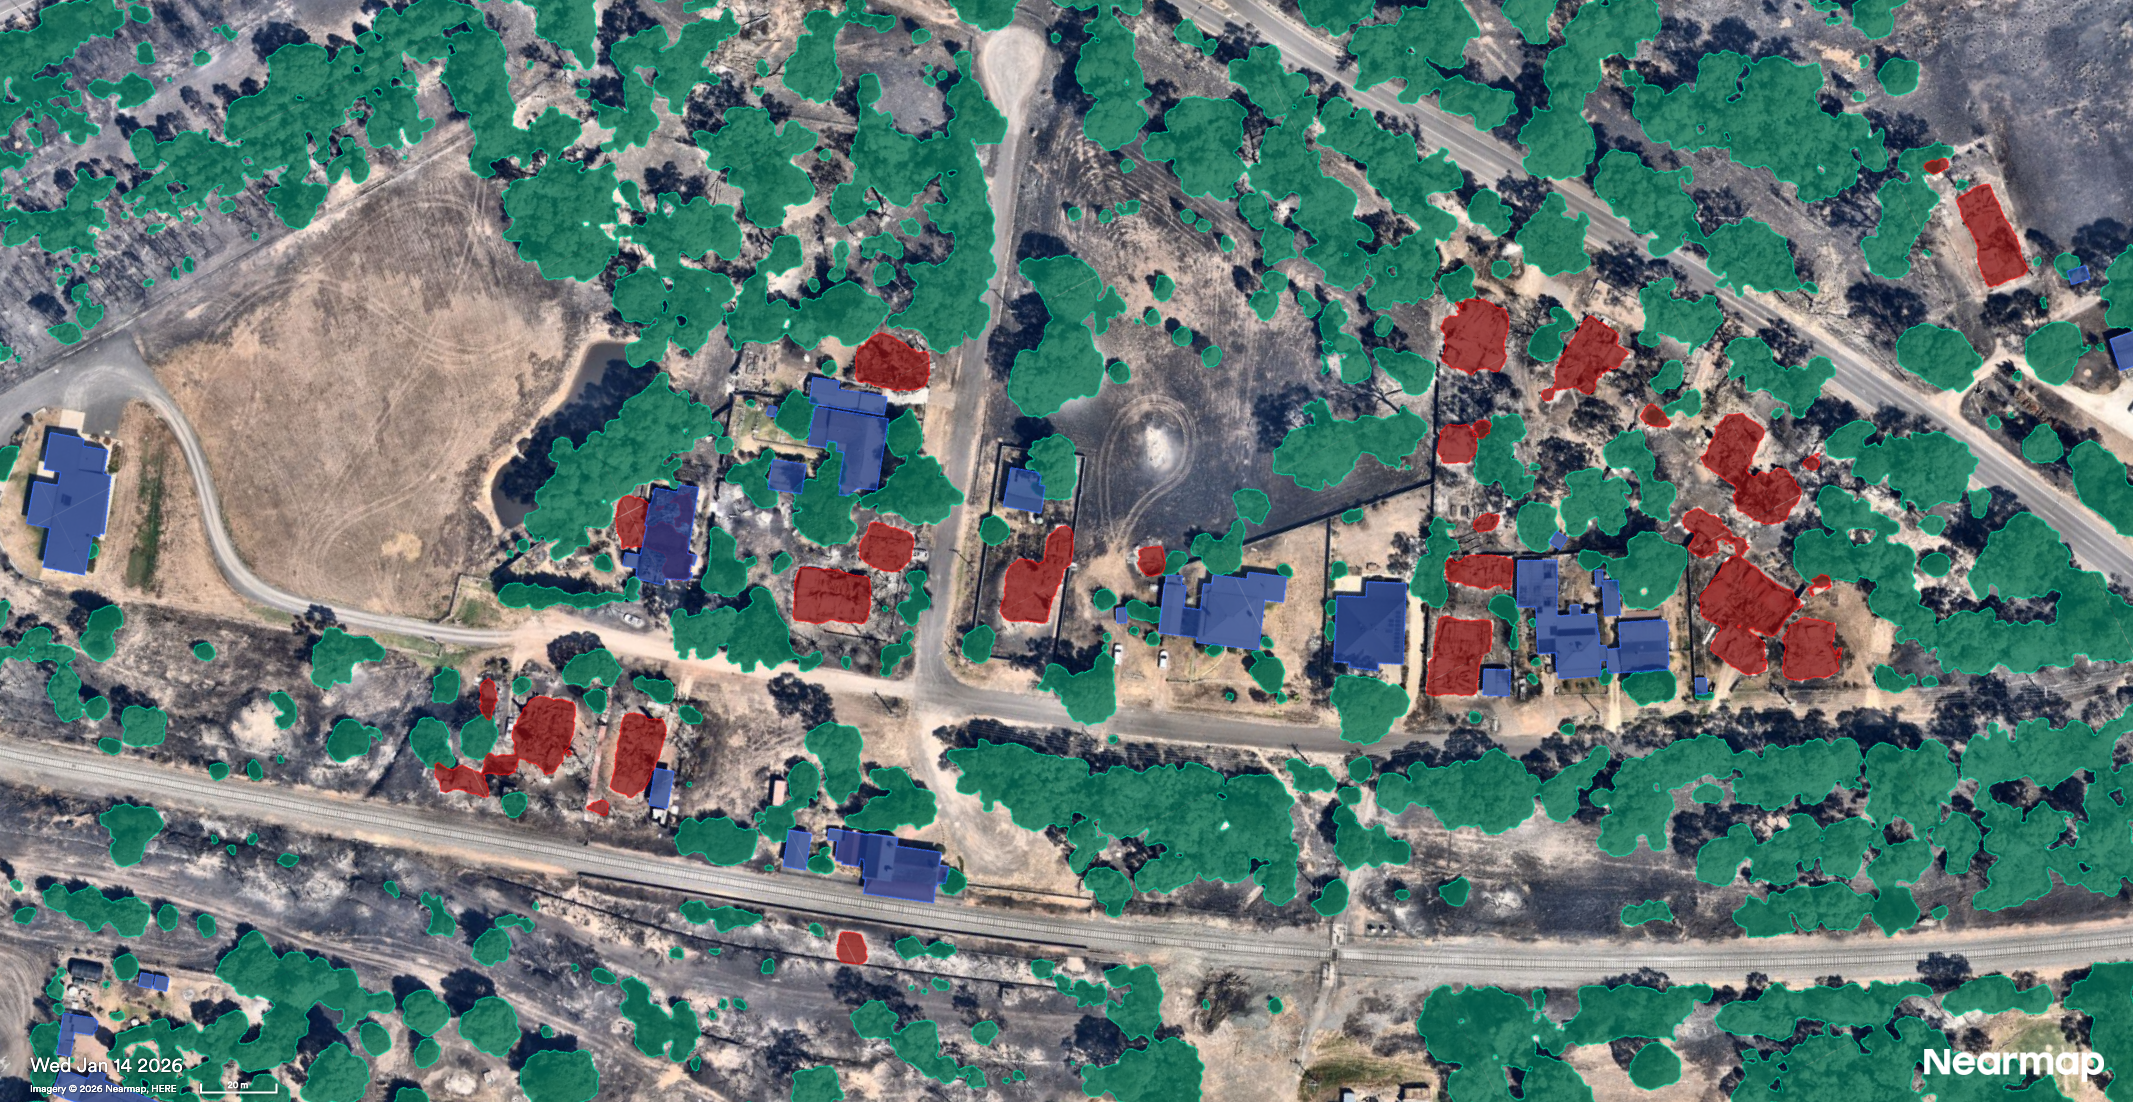
High-resolution aerial imagery, captured frequently and enhanced with AI, addresses all three: a single, verifiable, current source of truth shared across agencies, jurisdictions, and phases of the disaster lifecycle.
Tue Dec 29 2026
Wed Jan 14 2026

AI Layers: Blue - Building, Orange - Building Structural Loss, Green - Medium and High Vegetation


A framework for action: before, during, and after


Before: preparedness and mitigation

Councils use historical aerial imagery, refreshed multiple times a year, to track vegetation density, new construction near waterways, and terrain change that could alter flood behaviour. AI-powered analysis flags elevated-risk properties, feeding directly into risk assessments and grant applications. The same imagery supports evacuation planning, helping teams map access routes, identify safe zones, and confirm meet-up locations well before an incident occurs.

During: response and coordination

Aircraft are deployed as soon as conditions allow, with imagery processed and published within a 25-hour average. AI-identified features surface structural damage, repairs, debris, junk, and wreckage at scale, so teams can direct finite resources to the areas of greatest need.

After: recovery and reconstruction

Government agencies need accurate damage counts to activate funding, aid organisations need eligibility evidence, and rebuild planners need precise measurements. One aerial data source, with AI-identified features and historical comparisons, serves all three simultaneously.

Choosing the right tool: satellite, drone, or aircraft

The imagery capture platform determines what you can see, how much you can cover, and how fast you can act. 
Satellite imagery covers vast areas but lacks resolution for property-level damage assessment. 
Drones deliver fine detail but only over small sites, and deployment logistics in a disaster zone are complex, requiring licensed pilots, flight authorisation, and time for the imagery to upload to the cloud and propagate fully.
Aircraft-captured imagery sits in the useful middle: granular enough for property-level analysis, wide enough for regional assessment, fast enough to inform decisions in hours, not weeks.
Resolution
Coverage
Turnaround
Historical library

Drone

1-2cm

Site-specific

Hours (small area)

Typically none

Nearmap (aircraft)

4.4-7.5cm GSD

Wide-area at scale

25-hour average

20 years

Satellite

30-50cm

Very wide

Days to weeks

Limited

Australian-founded and built aerial data intelligence

Nearmap operates patented aircraft-mounted camera systems, designed and assembled at Nearmap headquarters in Barangaroo, Sydney, capturing imagery at 4.4-7.5cm Ground Sample Distance across areas representing up to 95 per cent of the Australian population, with metropolitan areas refreshed up to six times a year. 
When disasters strike, aircraft are deployed as soon as conditions allow, with a 25-hour average from capture to published imagery. Nearmap AI layers then automate feature identification and damage classification at a scale manual inspection cannot match, accessible through MapBrowser or via API into Esri ArcGIS, Autodesk, Bentley Systems, Cityworks, Cesium, and PlanIt Geo.

The Nearmap intelligence suite

Captured from the sky, accessible in the cloud
Aircraft carrying the Nearmap HyperCamera technology frequently capture the data story of our evolving urban and regional landscapes from above. 
View in MapBrowser, the Nearmap web-app, or seamlessly introduce it into your existing set up via GIS and CAD platforms, including the industry-leading Esri ArcGIS, Bentley Systems, Autodesk and more.

Vertical imagery: High-resolution orthogonal (top-down) views providing wide-area coverage, updated frequently.
Oblique imagery: Viewpoints at 30°–45° from multiple directions, enabling accurate measurements of height, width and area.
Panorama imagery: A fixed 45° bird’s-eye view from all four cardinal directions for inspections where measurement isn’t required, seeing over and around obstructions.
3D modelling: Textured Mesh, Point Cloud, True Ortho, Digital Terrain Model (DTM) and Digital Surface Model (DSM) for reality models with accurate perspectives.
AI insights: 130+ property insights from AI trained on owned data, detecting features and conditions such structurally damaged roofs, debris, and tarps, turning imagery into decision-ready intelligence.
Near Infrared (NIR) detection: Imagery beyond visible light for vegetation health analysis and burn-scar mapping.
Digital Elevation and Terrain Models: DEM and DTM data for flood modelling, terrain analysis and risk assessment.

Seeing the complete picture after disaster strikes


When cyclones, bushfires, and floods hit, decision-makers need accurate, current information fast. Nearmap ImpactResponse delivers that visibility, from first capture through to recovery.
ImpactResponse Imagery
Nearmap deploys aircraft as soon as it is safe to fly after a cyclone, bushfire, or flood, addressing the critical need for speed after a catastrophic event. Imagery is published within 24–48 hours of capture, faster than traditional collection methods. When the situation on the ground is evolving, Nearmap captures additional surveys of the same areas in the following days for the most current view available.
Post-event imagery is captured at a consistent 4.4–7.5 cm GSD or better, giving response teams the resolution to detect and quantify property damage, measure structures, and identify access constraints. Coverage scales to the full footprint of the event, from a single suburb to tens of thousands of properties across multiple regions.
Damage Detections AI
Damage Detections AI uses AI-derived property condition and damage data, extracted from post-catastrophe imagery, to determine repair and replacement costs, reducing reliance on manual field assessment.
Damage Classifications AI
Damage Classifications AI applies a five-tier damage classification across every affected property in the event footprint, helping governments quickly identify affected areas, prioritise aid, and support funding requests.
2025 ImpactResponse in numbers
  • 24 unique disaster events captured
  • 99 survey areas flown
  • 13,798 sq km covered
  • 25-hour average capture-to-publish time
  • Historical post-disaster library backdated to 2014
  • 4.4–7.5cm Ground Sample Distance

Evidence from the field


The examples below span the disaster lifecycle directly: response coordination, and recovery and eligibility decisions.
Use case spotlight

City of Moreton Bay

Facing increasingly challenging fire seasons, the City of Moreton Bay needed a faster way to manage the bushfire trails its fire appliances rely on, across hundreds of hectares of often-inaccessible bushland. Nearmap imagery, integrated into the council’s FireMapper platform, lets the fire management team map, measure, and verify trails, and track how burn areas change year on year, without walking the terrain on foot.

“The intelligence we can gather before we arrive is critically important.” — Adam Nicholas, Fire Management Coordinator, City of Moreton Bay

Using historical and current aerial imagery alongside elevation modelling, the team plans burns, identifies access points, and extends or reroutes trails with greater accuracy, reducing the risk of costly rework and keeping crews within safe working perimeters.

Use case spotlight

Red Cross Australia

After the 2019-2020 bushfire crisis destroyed nearly 3,000 homes, Red Cross Australia needed to know which properties were genuinely fire-affected to determine grant eligibility for up to $70,000 per household. Nearmap imagery, captured within days of the fires, gave the grants team a verifiable evidence layer.

“We could actually see if there was any sign of fire near the area in question, and the exact distance from the property to fire damage, so our grants team could determine eligibility. We looked at other Geographic Information System providers that are active in this space, but Nearmap provided the most clarity.”John Santiago, Business Analyst, Red Cross Australia

Red Cross Australia provided more than 6,000 people with grants and distributed more than $200 million in financial aid, with decisions underpinned by verifiable aerial evidence.

Use case spotlight

A1 Services

A1 Services provides residential property and infrastructure inspections, assessments, and reports for Australian communities affected by natural disasters, where speed and accuracy determine how quickly affected families get answers. By comparing Nearmap imagery of properties before and after flooding, A1 Services has conducted more than 12,000 flood assessments and delivered insurance insights on more than 14,000 property and site assessments, without waiting for physical site access delayed by floodwaters or road closures.

“The information we give to government and the resident is as accurate as it can be.”James McInerney, Disaster Estimating Manager, A1 Services 


The case for action


Natural disasters cost Australia $38 billion a year today, projected to reach $73 billion by 2060.1 In 2025 alone, insured losses reached $4.8 billion, a 727 per cent jump on the year before.2 Every dollar invested in risk reduction saves between $2 and $11.4 The economic logic is settled, and it is already working for the disaster recovery organisations supporting Australian communities after bushfires and floods.
What remains is execution, and the path to it is more direct than a standard technology purchase. Nearmap is already accessible through state and local government supplier panels and whole-of-government procurement arrangements, so agencies do not need to build a business case from a blank page.
The next step is a jurisdiction-specific briefing: bring your coverage area and current workflow, and we will show what a shared operating picture looks like for your team, before your next event, not after it.

Bring your challenge to Nearmap

Backed by teams of data scientists, software engineers, and technology innovators based in Australia, Nearmap is ready to take on the challenges facing government and disaster management agencies, from disaster preparedness and response to long-term community resilience.
Contact Us For A Demo
Citations
1. Deloitte Access Economics, Update to the economic costs of natural disasters in Australia, commissioned by the Australian Business Roundtable for Disaster Resilience & Safer Communities.
2. Insurance Council of Australia, extreme weather event and catastrophe data, 2023-2025, including full-year 2025 results reported April 2026.
3. Insurance Business Australia, Cyclone Alfred anniversary reporting on insured and total economic costs, March 2026.
4. Climate Change Authority, Home Safe: National leadership in adapting to a changing climate, 2025, referencing CSIRO research.
5. Deloitte Access Economics, The economic and social impact of disasters on children and young people, commissioned by UNICEF Australia, 2025.
6. Productivity Commission, Natural Disaster Funding Arrangements, Inquiry Report No. 74, and Report on Government Services, Section D: Emergency Management.
7. National Emergency Management Agency (NEMA), Disaster Ready Fund Round Three (2025-26) and Round Four (2026-27) guidelines.
8. Independent Review of National Natural Disaster Governance Arrangements, Final Report.