Introducing Nearmap for Post-catastrophe Response
Post Catastrophe Imagery and AI-derived property damage and condition data unite to help insurers process customer claims more efficiently.
Post Catastrophe Imagery and AI-derived property damage and condition data unite to help insurers process customer claims more efficiently.
ACT median suburb achieves 5.4% relative* gain in residential tree cover over the past year
Aranda, Belconnen, is Canberra’s leafiest residential suburb in 2022
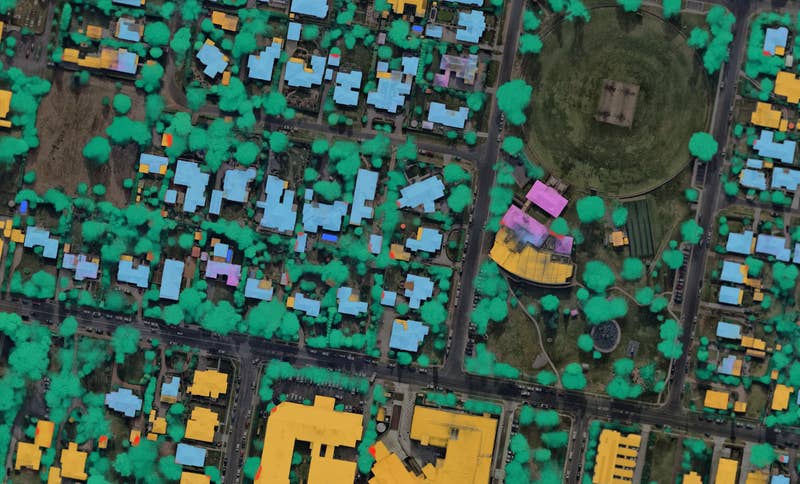
Year-on-year tree canopy increase quantified following analysis of artificial intelligence data sets and high-resolution, city-wide aerial imagery by location intelligence firm Nearmap
CANBERRA, AUSTRALIA (Embargoed until 25 May 2022, 00:15) – All residential suburbs in Greater Canberra have gained tree cover since the introduction of the Australian Capital Territory’s Urban Forest Strategy in March 2021. The increase is helping the ACT on its way to reaching its target to have 30% of the urban environment covered by tree canopy by 2045.
The tree cover analysis was produced by location intelligence and aerial imagery company Nearmap. The Australian technology firm has quantified changes in tree cover across 93 residential suburbs across Canberra by analysing high-resolution aerial imagery, and artificial intelligence data sets from 2021 and 2022 on matched seasons (Jan - Mar each year).
The analysis was led by Dr Michael Bewley, Senior Director of Artificial Intelligence Systems, at Nearmap who said: “Nearmap has studied tree cover changes nationally to assist urban planners, designers, councils, and government organisations providing reliable, up-to-date, and detailed information to help them make informed decisions, and better plan and build the cities of the future.”
“We were pleased to find consistent growth in tree cover over the past year across Greater Canberra. Not a single suburb in Australia’s capital city has seen a drop in residential tree canopy. In fact, the median ACT suburb achieved a relative* increase of 5.4% residential tree cover over the past year. It is very important to proactively monitor these changes. Trees take many years to grow and we’re better able to respond if we can identify as early as possible the impacts of policy and climate".
In the ACT:
Dr Michael Bewley, Senior Director of Artificial Intelligence Systems, at Nearmap added: “The consistency, quality, and regularity of Nearmap aerial captures has enabled us to provide a powerful picture of changes of urban forests across residential suburbs in Canberra.
“Nearmap provides location insights and high-resolution aerial imagery over time that can reveal the impact of planning decisions on our neighbourhoods and cities. For cities like Canberra, this is a powerful tool to monitor the growth of our urban forest and assess how we ’re tracking towards the goal of building and maintaining resilient and sustainable tree canopy.”
| Suburb | Region | Residential Tree Cover 2022 |
| Aranda | Belconnen | 37.2% |
| Reid | North Canberra | 33.9% |
| O'Connor | North Canberra | 33.3% |
| Ainslie | North Canberra | 32.3% |
| Cook | Belconnen | 31.4% |
| Deakin | South Canberra | 30.9% |
| Yarralumia | North Canberra | 30.9% |
| Downer | South Canberra | 30.4% |
| Hughes | Woden Valley | 30.1% |
| Hacket | North Canberra | 30% |
| Forrest | South Canberra | 29.9% |
| Suburb | Region | Residential Tree Cover 2022 |
| Wright | Molonglo | 2.2% |
| Coombs | Molonglo | 2.3% |
| Casey | Gungahlin | 4.2% |
| Bonnor | Gungahlin | 4.9% |
| Crace | Gungahlin | 7.2% |
| Forde | Gungahlin | 9.2% |
| Franklin | Gungahlin | 9.7% |
| Harrison | Gungahlin | 10.2% |
| Gungahlin | Gungahlin | 10.9% |
| City | North Canberra | 13.6% |
Nearmap has revealed the tree coverage of the ACT using its Artificial Intelligence (AI) data and location intelligence tools. Nearmap AI uses machine learning to turn the company’s high-resolution aerial imagery that covers 90% of the Australian population into information and insights, creating one of the most accurate and richest AI offerings in the market. Around 90% of Australia’s top construction companies rely on Nearmap technology and content, and so do more than 250 customers across government and insurance.
Learn more about Nearmap or schedule a demo.
*NB: Relative change is the change i n residential tree cover, as a proportion of the pre - existing cover in 2021 (ie relative change = [% of tree canopy in 2022 - % of tree canopy in 2021] / [% of tree canopy in 2021] x 100%).
**Rounding: In calculating the relative change, we used the numbe rs prior to rounding for the 2021 and 2022 tree cover. Then, for presentation purposes, we rounded all figures to two significant figures (e.g. 122% becomes 120%), or 1 significant figure for numbers below 1%. Rounding significant figures is a standard sci entific approach to assist the reader to get a clearer sense of the realistic accuracy of the number.
