Introducing Nearmap for Post-catastrophe Response
Post Catastrophe Imagery and AI-derived property damage and condition data unite to help insurers process customer claims more efficiently.
Post Catastrophe Imagery and AI-derived property damage and condition data unite to help insurers process customer claims more efficiently.
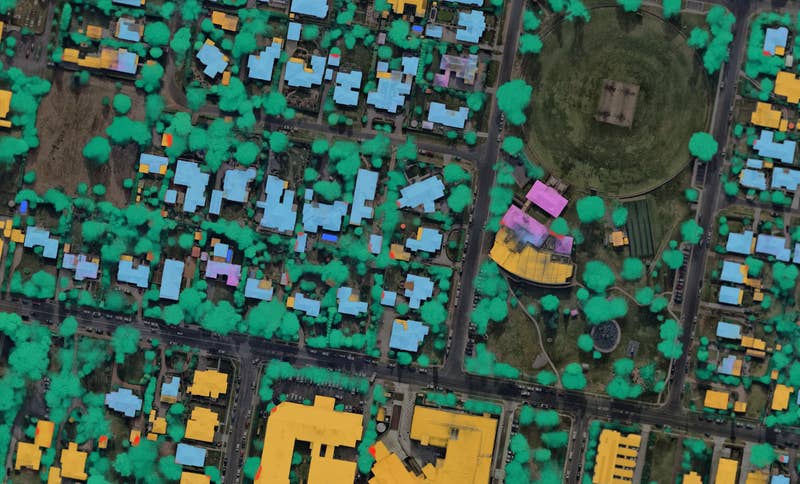
How livable is your city? Did you know you can analyse and monitor change in tree canopy with over 10 years of historical data? Leverage the power of Nearmap AI to access vegetation coverage to better inform your strategy toward a greener future. Nearmap AI takes data that traditionally is only available via LiDAR and shows equivalent and comparable quality.
Some LGAs list the same suburb as both the 'greenest suburb' and 'least green suburb'. This means that there was only a single residential suburb within the LGA fully covered by the analysis.
Nearmap does not warrant or accept any liability in relation to the accuracy, correctness or reliability of the data provided as part of the Nearmap Leafiest Suburbs analysis. The Nearmap Leafiest Suburbs analysis is based on Nearmap AI data, which detects trees approximately 2m or higher. The national aerial data was collected Oct 2020-March 2021. Results were aggregated at mesh block level using the 2021 Australian Bureau of Statistics definitions. Approximately 5,000 suburbs were included in the analysis, where Nearmap AI coverage exceeded 99%. The top suburbs are those with the greatest percent tree cover in each 2021 SA4 region, and where there is a minimum population of 1,000 residents (2016 census). For suburbs that span multiple LGAs, that suburb is assigned to the LGA that contains the highest proportion of that suburb’s area. City-based metrics analyse all Nearmap AI covered suburbs within the relevant ABS GCCSA region. For the capital city suburb breakdowns, we also refined the analysis to only include ‘residential’ mesh blocks. All percentage figures have been rounded to the closest whole number.
